
Page 89 - 《中国药科大学学报》2026年第1期
P. 89
第 57 卷第 1 期 姚深梦,等:复方仙鹤草肠炎胶囊调控胆汁酸代谢改善溃疡性结肠炎湿热证的作用 83
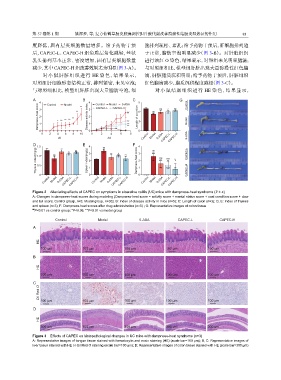
度降低,固有层炎细胞数量增多。给予药物干预 胞排列疏松、紊乱;给予药物干预后,肝细胞排列趋
后,CAPEC-L、CAPEC-H 组角质层角化减轻,丝状 于正常,脂肪空泡明显减少(图 3-B)。对肝脏组织
乳头排列基本正常、密度增加,固有层炎细胞数量 进行油红 O 染色,结果显示,对照组未见明显脂滴;
减少,其中 CAPEC-H 组改善效果尤为明显(图 3-A)。 与对照组相比,模型组肝脏出现大量弥漫性红色脂
对小鼠肝脏组织进行 HE 染色,结果显示, 滴,肝脏脂质沉积明显;给予药物干预后,肝脏组织
对照组肝细胞形态结构正常,排列紧密,未见空泡; 红色脂滴减少,脂质沉积程度减轻(图 3-C)。
与对照组相比,模型组肝脏出现大量脂肪空泡,细 对小鼠结肠组织进行 HE 染色,结果显示,
A 4 Control Model ** B 4 Control Model 5-ASA C 9 G Control
Dampness-heat score 3 2 1 * ** ** ** ** ** Disease activity index 3 2 1 ## Length of colon/cm 6 3 ## ns * ** Model
CAPEC-H
CAPEC-L
**
**
0
0 2 4 6 8 10 0 0 2 4 6 ** 8 0
t/d t/d Control Model 5-ASA CAPEC-L CAPEC-H 5-ASA
D 1.5 ** * ** E 4 ## F 4 ##
Thymus index/(mg/g) 1.0 ## Spleen index/(mg/g) 3 2 1 ** * ** Dampness-heat score 3 2 1 ns ns ** CAPEC-L
0.5
0 0 0 CAPEC-H
Control Model 5-ASA CAPEC-L CAPEC-H Control Model 5-ASA CAPEC-L CAPEC-H Control Model 5-ASA CAPEC-L CAPEC-H
Figure 2 Alleviating effects of CAPEC on symptoms in ulcerative colitis (UC) mice with dampness-heat syndrome ( x ± s)
A: Changes in dampness-heat scores during modeling (Dampness-heat score = activity score + mental status score + coat condition score + claw
and tail score; Control group, n=5; Model group, n=30); B: Index of disease activity in mice (n=5); C: Length of colon (n=3); D, E: Index of thymus
and spleen (n=3); F: Dampness-heat scores after drug administration (n=5) ; G: Representative images of colon tissue
##
P<0.01 vs control group; *P<0.05, **P<0.01 vs model group
Control Model 5-ASA CAPEC-L CAPEC-H
A
HE
100 μm 100 μm 100 μm 100 μm 100 μm
B
HE
100 μm 100 μm 100 μm 100 μm 100 μm
C
Oil Red O 100 μm 100 μm 100 μm 100 μm
D 100 μm
HE
300 μm 300 μm 300 μm 300 μm 300 μm
Figure 3 Effects of CAPEC on histopathological changes in UC mice with dampness-heat syndrome (n=3)
A: Representative images of tongue tissue stained with hematoxylin and eosin staining (HE) (scale bar=100 μm); B, C: Representative images of
liver tissue stained with HE or Oil Red O staining (scale bar=100 μm); D: Representative images of colon tissue stained with HE (scale bar=300 μm)