
Page 92 - 《中国药科大学学报》2026年第1期
P. 92
86 学报 Journal of China Pharmaceutical University 2026, 57(1): 78 − 89 第 57 卷
A B C
CA 1.5 UDCA 1.0 UDCA 1.0
CDCA 1.0 α-MCA α-MCA
α-MCA 0.5 β-MCA 0.5 β-MCA 0.5
β-MCA 0 ω-MCA ω-MCA
HDCA CA 0 CA 0
UDCA −0.5 CDCA CDCA
ω-MCA −1.0 Tα-MCA −0.5 Tα-MCA −0.5
DCA −1.5 Tβ-MCA Tβ-MCA
TCA TCA TCA
TCDCA TCDCA TCDCA
Tα-MCA GCDCA GCDCA
GCA TDCA TDCA
GCDCA TUDCA TUDCA
Tβ-MCA GUDCA GUDCA
GUDCA GCA GCA
TDCA DCA DCA
TUDCA HDCA HDCA
GDCA TLCA TLCA
TLCA GDCA GDCA
Control Model 5-ASA CAPEC-H IL-6 IL-1β TNF-α NO IL-6 IL-1β TNF-α iNOS
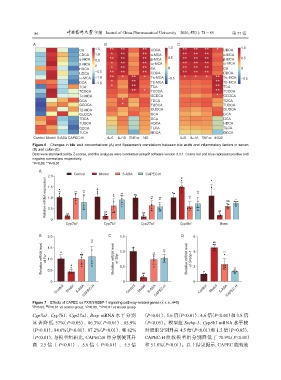
Figure 6 Changes in bile acid concentrations (A) and Spearman’s correlations between bile acids and inflammatory factors in serum
(B) and colon (C)
Data were standardized by Z-scores, and the analyses were conducted using R software version 3.3.1. Colors red and blue represent positive and
negative correlations respectively
*P<0.05, **P<0.01
A
2.0 Control Model 5-ASA CAPEC-H #
Relative mRNA expression 1.5 ** ** * ** ** ** ** ** ns *
1.0
0.5
0 ## ## ## ##
Cyp7a1 Cyp7b1 Cyp27a1 Cyp8b1 Bsep
B 2.0 C 1.5 D 6
** ##
Relative mRNA level of Fxr 1.0 # * Relative mRNA level of Shp 1.0 ** ** Relative mRNA level of Srebp-1 4 2 ** **
1.5
0.5
0.5
0 0 ## 0
Control Model 5-ASA CAPEC-H Control Model 5-ASA CAPEC-H Control Model 5-ASA CAPEC-H
Figure 7 Effects of CAPEC on FXR/SREBP-1 signaling pathway-related genes ( x ± s, n=5)
# ##
P<0.05, P<0.01 vs control group; *P<0.05, **P<0.01 vs model group
Cyp7a1、Cyp7b1、Cyp27a1、Bsep mRNA 水平分别 (P<0.01)、5.6 倍(P<0.01)、4.6 倍(P<0.01)和 3.8 倍
显著降低 57%(P<0.05)、86.3%(P<0.01)、85.9% (P<0.05)。模型组 Srebp-1、Cyp8b1 mRNA 水平较
(P<0.01)、84.6%(P<0.01)、87.2%(P<0.01)、和 82% 对照组分别升高 4.5 倍(P<0.01)和 1.5 倍(P<0.05),
(P<0.01),与模型组相比,CAPEC-H 组分别使其升 CAPEC-H 组较模型组分别降低了 70.9%(P<0.01)
高 2.5 倍 ( P<0.01) 、 5.6 倍 ( P<0.01) 、 5.5 倍 和 51.8%(P<0.01)。以上结果提示,CAPEC 能有效