Page 217 - 《水产学报》2025年第8期
P. 217

郑家浪,等                                                                 水产学报, 2025, 49(8): 089618

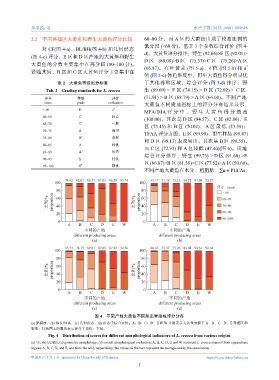
              2.2    不同养殖区大黄鱼和野生大黄鱼评分比较                        60~80  分,而   A  区的大黄鱼出现了较高比例的
                                                               低分段    (<60  分)。基于   3  个参数综合评价        (图  4-
                   对  CF(图  4-a)、BL/BH(图   4-b) 和几何形态
                                                               d),大黄鱼评分排序:野生            (92.66)>E  区  (92.01)>
              (图  4-c) 评分,E   区和   D  区产地的大黄鱼和野生
                                                               D  区  (89.08)>B  区  (75.37)>C  区  (75.26)>A  区
              大黄鱼的分数主要集中在高分段                   (80~100  分)。
                                                               (66.87)。在叶黄素      (图  5-a)、b 值 *  (图  5-b) 和  a *
              紧随其后,B       区和   C  区大黄鱼评分主要集中在
                                                               值  (图  5-c) 体色维度中,野生大黄鱼得分明显优

                          表 2    大黄鱼等级划分标准                     于其他养殖区域,综合评分               (图  5-d) 排序:野
                     Tab. 2    Grading standards for L. crocea  生  (99.09) > E  区  (74.15) > D  区  (72.02) > C  区
                    评分            等级             评价            (71.91) > B  区 (68.79) > A  区 (64.08)。不同产地
                    score         grade        evaluation
                                                               大黄鱼不同质地指标上的评分分布结果显示,
                   < 60            D             差
                                                               MFA/IMA  评 分 中 , 野 生 大 黄 鱼 得 分 最 高
                   60~65           C             较差
                                                               (100.00),其次是    D  区 (84.57)、C  区 (82.86)、E
                   65~70           C +           一般
                                                               区  (73.45) 和  B  区  (70.02), A  区 最 低  (53.59);
                   70~75           B             尚可
                                                               TFAA  评分方面,E      区 (99.99)、野生样品 (99.47)
                   75~80           B +           良好
                                                               和  D  区 (98.13) 表现突出,其次是        B  区 (90.55),
                   80~85           A             较优
                                                               而  C  区 (72.93) 和  A  区较低 (47.40)(图  6)。质地
                   85~90           A +           优秀
                                                               综合评分排序:野生 (99.73) > D          区  (91.60) >E
                   90~95           S             特优
                                                               区 (86.87)>B  区 (81.56)>C  区 (77.52)>A  区  (50.60)。
                   95~100          S +           极优
                                                               不同产地大黄鱼在水分、粗脂肪、∑n-6 PUFAs、

                             74.62 82.07 86.31 87.05 96.29 95.14  61.11 71.78 75.13 94.21 97.09 92.27
                        100                                 100
                                                                                              评分`score
                         80                                  80                                 < 60
                     比例/%  proportion  60                  比例/%  proportion  60                 60~70
                                                                                                70~80
                                                             40
                         40
                         20                                  20                                 80~90
                                                                                                90~100
                          0                                   0
                              A    B   C    D    E   W            A    B    C   D    E    W
                                     不同的产地                               不同的产地
                                different producing areas            different producing areas
                                        (a)                                  (b)
                             65.53 74.15 69.81 87.05 87.43 92.56  66.87 75.37 75.26 89.08 92.61 92.66
                        100                                 100
                         80                                  80
                     比例/%  proportion  60                  比例/%  proportion  60
                         40
                                                             40
                         20                                  20
                          0                                   0
                              A    B   C    D    E   W            A    B    C   D    E    W
                                     不同的产地                               不同的产地
                                different producing areas            different producing areas
                                        (c)                                  (d)
                                         图 4    不同产地大黄鱼不同形态学指标评分分布

              (a) 肥满度,(b) 体长/体高,(c) 几何形态,(d) 形态学综合评价;A、B、C、D、E       和  W  分别表示大黄鱼来源于    A、B、C、D、E  养殖区和
              野生;柱状图上的数值表示评分平均值;下同。
                      Fig. 4 Distribution of scores for different morphological indicators of L. crocea from various origins
              (a) CF, (b) BL/BH, (c) geometric morphology; (d) overall morphological evaluation; A, B, C, D, E and W represent L. crocea sourced from aquaculture
              regions A, B, C, D, and E, and from the wild, respectively; the values on the bars represent the average scores; the same below.

              中国水产学会主办  sponsored by China Society of Fisheries                          https://www.china-fishery.cn
                                                            7
   212   213   214   215   216   217   218   219   220   221   222