Page 216 - 《水产学报》2025年第8期
P. 216

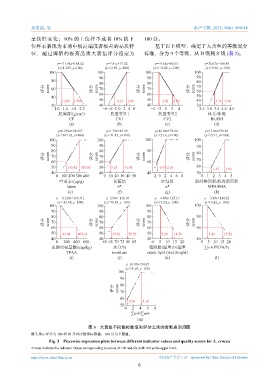
郑家浪,等                                                                 水产学报, 2025, 49(8): 089618

              呈线性变化;10%          的上位样本或者         10%  的下       100  分。
              位样本表现为市场中极高端或者极差的品质特                                 基于以上模型,确定了大黄鱼的等级划分
              征,超过阈值的极高品质大黄鱼评分稳定为                              标准,分为      9  个等级,从     D  级到  S 级 +  (表  2)。


                         y=−71.94x+188.42     y=7.81x+77.42        y=−9.64x+80.53       y=74.07x−188.89
                          (x<1.229, y=100)    (x≥2.89, y=100)     (x≤−2.02, y=100)       (x≥3.90, y=100)
                      100                 100                  100                  100
                                           90                   90                   90
                       80                                                            80
                    评分  score  60        评分  score 80        评分  score 80         评分  score  70
                                                                70
                                           70
                                                                                     60
                                           60                   60                   50
                       40
                           1.229  1.785    50     −2.23  2.89   50   −2.02  2.13     40      3.36 3.90
                       20                  40                   40                   30
                        1.0 1.4 1.8 2.2      −6−4−2 0  2  4  6   −4 −2  0  2  4       2.5 3.0 3.5 4.0 4.5
                                    3
                          肥满度/(g/cm )           典型变量1               典型变量2                 体长/体高
                              CF                  CV1                  CV2                 BL/BH
                               (a)                 (b)                  (c)                 (d)
                          y=0.232x+28.557     y=1.79x+43.59        y=12.94x+72.04        y=17.86x+30.18
                         (x≥307.65, y=100)   (x≥31.45, y=100)      (x≥2.16, y=100)      (x≥3.91, y=100)
                      100                 100                  100                  100
                       90                  90                                        90
                    评分  score 80         评分  score 80        评分  score 80         评分  score  80
                       70
                                           70
                                                                                     70
                       60                  60                   60
                       50     135.42  307.65  50  9.15  31.45       −0.93 2.16       60     1.67  3.91
                       40                  40                   40                   50
                         0 100 200 300 400   0 10  20 30 40 50    −2 0 2 4 6 8         0 1 2 3 4 5
                          叶黄素/(μg/g)             黄蓝值                  红绿值           肌纤维面积/肌内膜面积
                              lutein               b*                   a*                MFA/IMA
                              (e)                  (f)                 (g)                  (h)
                         y=−0.124x+110.311    y=2.90x−131.03       y=−4.80x+125.13      y=−3.45x+114.22
                          (x≤83.08, y=100)   (x≥79.59, y=100)      (x≤5.24, y=100)      (x≤4.12, y=100)
                      100                 100                  100                  100
                       90                  90                   90

                    评分  score 80         评分  score 80        评分  score 80         评分  score 80
                                                                70
                                           70
                       70
                       60                  60                   60                   60
                       50   83.08  405.38  50    65.81  79.59   50    5.24  13.58         4.12   15.71
                       40                  40                   40                   40
                         0  200 400 600      60 65 70 75 80 85    0  5  10 15 20       0  5 10 15 20
                       总游离氨基酸/(mg/kg)            水分/%            粗脂肪(湿重)/%湿重            ∑n-6 PUFA/%
                             TFAA                moisture       crude lipid (wet weight)
                               (i)                 (j)                 (k)                   (l)
                                                       y=10.99x+54.07
                                                       (x≥4.18, y=100)
                                                   100
                                                    90

                                                 评分  score  80
                                                    70
                                                    60  0.54  4.18
                                                    50
                                                      0  2  4   6  8
                                                         ∑n-3/∑n-6
                                                            (m)
                                       图 3    大黄鱼不同指标数值和评分之间的折断点回归图
              箭头指示评分为    100  和  60  分对应的指标数值,100  分为上限值。
                      Fig. 3 Piecewise regression plots between different indicator values and quality scores for L. crocea
              Arrows indicate the indicator values corresponding to scores of 100 and 60, with 100 as the upper limit.

              https://www.china-fishery.cn                           中国水产学会主办    sponsored by China Society of Fisheries
                                                            6
   211   212   213   214   215   216   217   218   219   220   221