Page 218 - 《水产学报》2025年第8期
P. 218

郑家浪,等                                                                 水产学报, 2025, 49(8): 089618

              ∑n-3/∑n-6  比值及综合评分结果显示,野生大黄                      区  (82.48)>E  区 (76.17)>B  区 (66.87)>A  区 (58.13)。
              鱼在所有指标中均获满分 (100.00),表现最佳                        最后,基于形态、体色、质地和营养的综合评
              (图  7)。D  区和  E  区在水分和粗脂肪上表现优异,                  分排序为:野生      (97.77)>D  区  (83.94)>E  区  (82.35)>
              但在∑n-6 PUFAs 和∑n-3/∑n-6      评分上与野生大             C  区  (76.79)>B  区  (73.15)>A  区  (59.92),对应等
                                                                         +
                                                                                                       +
              黄鱼存在差距,A          区的各项指标相对较低。营                   级分别为     S (极优)、A(较优)、A(较优)、B (良
              养综合评分排序:野生 (99.63)>D             区 (83.04)>C     好)、B(尚可) 和     D  级  (差) (表  3)。


                                                            110
                        110                                                                     A 65.13
                                                   97.52    100
                        100                   71.45          90                                 B 71.52
                      ွߛ෍௟ٳ  lutein score  80  59.71  65.9  70.60  71.42  b *  80               D 76.67
                                                                                                C 75.81
                         90
                                                                                                E 78.91
                         70
                                                             70
                                                                                                W 72.36
                         60
                         50                                  60
                         40                                  50
                              A   B    C   D   E    W                 1              2
                                     不同的产地                                ౼ဢൈࡗ
                                different producing areas                sampling time
                                        (a)                                  (b)
                        110                                 120
                                     70.76         99.68
                        100  71.92                          110                        98.95
                         90      71..89       66.68         100
                                          68.72                           72.28    73.72
                         80                                  90
                        a *                               ሸކ௟ٳ  overall score  69.91  72.21
                         70                                  80  65.31
                         60                                  70
                         50                                  60
                         40                                  50
                              A   B    C   D   E    W             A   B    C   D    E   W
                                     不同的产地                               不同的产地
                                different producing areas           different producing areas
                                        (c)                                 (d)
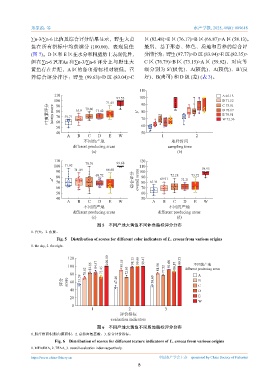
                                          图 5    不同产地大黄鱼不同体色指标评分分布
              1. 白天,2. 夜晚。
                         Fig. 5 Distribution of scores for different color indicators of L. crocea from various origins
              1. the day, 2. the night.


                              120              100.00     98.13  99.99   99.47  99.73
                                                                                    不同的产地
                              100       82.86   84.57  90.55         81.56  91.60  86.87  different producing areas
                                      70.02  73.45      72.93          77.52
                               80                                                     A
                            评分  score  60  53.59   47.40          50.60               B
                                                                                      C
                               40                                                     D
                                                                                      E
                               20
                                                                                      W
                                0
                                        1               2              3
                                                    评价指标
                                                evaluation indicators
                                          图 6    不同产地大黄鱼不同质地指标评分分布
              1. 肌纤维面积/肌内膜面积,2. 总游离氨基酸,3. 综合评价指标。
                        Fig. 6 Distribution of scores for different texture indicators of L. crocea from various origins
              1. MFA/IMA, 2. TFAA, 3. overall evaluation index respectively.

              https://www.china-fishery.cn                           中国水产学会主办    sponsored by China Society of Fisheries
                                                            8
   213   214   215   216   217   218   219   220   221   222   223