Page 110 - 《中国药科大学学报》2026年第1期
P. 110

104                      学报   Journal of China Pharmaceutical University 2026, 57(1): 98 − 107  第 57 卷
               A                  B                  C                   D                  E

                   4 3    **          30     **          90     **          80                 40      **
                  Neurological scores  2 1  Cerebral infarct rate/%  20  Brain water content/%  80  SOD/(U/mg protein)  60  **  MDA/(nmol/mg protein)  30


                                                                                               20
                                                                            40
                                      10
                                                                            20
                                                                                               10
                                                         70
                   0                   0                 70 0                0                  0
                     Sham  Model HGWD-H  Sham  Model HGWD-H  Sham  Model HGWD-H  Sham  Model HGWD-H  Sham  Model HGWD-H


                F                 G                  H                   I
                  15      **         150     **         200     **            Sham
                 NO/(mmol/mg protein)  10 5  TNF-α/(pg/mg protein)  100  IL-1β/(pg/mg protein)  150  Model


                                                        100
                                      50
                                                         50

                   0                   0                  0                 HGWD-H
                     Sham  Model HGWD-H  Sham  Model HGWD-H  Sham  Model HGWD-H


                                                                  -/-
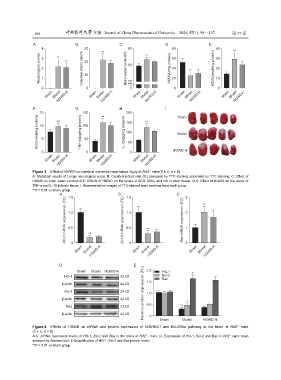
               Figure 3    Effect of HGWD on cerebral ischemia-reperfusion injury in Nrf2  mice( x ± s, n = 8)
               A: Statistical results of Longa neurological score; B: Cerebral infarct rate (%) assessed by TTC staining calculated by TTC staining; C: Effect of
               HGWD on brain water content; D-F: Effects of HGWD on the levels of SOD, MDA, and NO in brain tissue; G-H: Effect of HGWD on the levels of
               TNF-α and IL-1β in brain tissue; I: Representative images of TTC-stained brain sections from each group
               **P < 0.01 vs sham group
                           A   1.5                   B  1.5                   C   3

                              (FC)                     (FC)                      (FC)    **
                              expression  1.0          expression  1.0           expression  2


                              mRNA  0.5  **            mRNA  0.5  **             mRNA  1

                              HO-1  0                  Bcl-2  0                  Bax  0
                                  Sham  Model HGWD-H       Sham  Model HGWD-H       Sham  Model HGWD-H


                           D                               E
                                   Sham  Model  HGWD-H         (FC)  2.0  HO-1       *
                             HO-1                    32 kD              Bcl-2
                                                                        Bax
                            β-actin                  42 kD     expression  1.5
                             Bcl-2                   26 kD       1.0
                                                               protein            *
                            β-actin                  42 kD
                              Bax                    21 kD       0.5           **
                                                               Relative
                            β-actin                  42 kD        0    Sham     Model    HGWD-H


                                                                                                        -/-
               Figure 4    Effects  of  HGWD  on  mRNA  and  protein  expression  of  Nrf2/HO-1  and  Bcl-2/Bax  pathway  in  the  brain  of  Nrf2   mice
               ( x ± s, n = 8)
                                                                 -/-
                                                                                                     -/-
               A-C: mRNA expression levels of HO-1, Bcl-2 and Bax in the brain of Nrf2 - mice; D: Expression of HO-1, Bcl-2 and Bax in Nrf2  mice brain
               assayed by Western blot; E:Quantification of HO-1, Bcl-2 and Bax protein levels
               **P < 0.01 vs sham group
   105   106   107   108   109   110   111   112   113   114   115