
Page 67 - 《中国药科大学学报》2025年第5期
P. 67
第 56 卷第 5 期 刘 颖,等:豆蔻明通过 mTOR-ROS 轴抑制肺成纤维细胞衰老的机制 599
A B
Bleomycin (0.5 μg/mL) − + + +
Cardamonin (10 μmol/L) − − + +
MHY1485 (5 μmol/L) − − − + 15 ****
ROS + /all cells/% 5
ROS 10 **** ****
Hoechst
0
Bleomycin (0.5 μg/mL) − + + +
Cardamonin (10 μmol/L) − − + +
MHY1485 (5 μmol/L)− − − +
Merge
100 μm
C D 100 **** ****
Bleomycin (0.5 μg/mL) − + + + 80 ***
Cardamonin (10 μmol/L) − − + + 60
MHY1485 (5 μmol/L) − − − + SA-β-gal positive cell/% 40
SA-β-gal 20
50 μm 0
Bleomycin (0.5 μg/mL) − + + +
Cardamonin (10 μmol/L) − − + +
MHY1485 (5 μmol/L) − − − +
E F
Bleomycin (0.5 μg/mL) − + + + 6
Cardamonin (10 μmol/L) − − + + * *
MHY1485 (5 μmol/L) − − − + kD 4 *
Collagen 180 Relative Collagen protein level
α-SMA 40 2
0
β-actin 40 Bleomycin (0.5 μg/mL) − + + +
Cardamonin (10 μmol/L) − − + +
MHY1485 (5 μmol/L) − − − +
G 4 * **
Relative α-SMA protein level 3 2 1 **
0
Bleomycin (0.5 μg/mL) − + + +
Cardamonin (10 μmol/L) − − + +
MHY1485 (5 μmol/L) − − − +
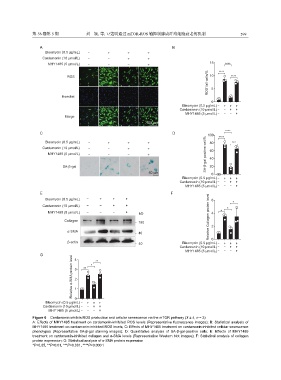
Figure 6 Cardamonin inhibits ROS production and cellular senescence via the mTOR pathway ( x ± s, n = 3)
A: Effects of MHY1485 treatment on cardamonin-inhibited ROS levels (Representative fluorescence images); B: Statistical analysis of
MHY1485 treatment on cardamonin-inhibited ROS levels; C: Effects of MHY1485 treatment on cardamonin-inhibited cellular senescence
phenotypes (Representative SA-β-gal staining images); D: Quantitative analysis of SA-β-gal-positive cells; E: Effects of MHY1485
treatment on cardamonin-inhibited collagen and α-SMA levels (Representative Western blot images); F: Statistical analysis of collagen
protein expression; G: Statistical analysis of α-SMA protein expression
*P<0.05, **P<0.01, ***P<0.001, ****P<0.000 1