Page 44 - 《水产学报》2026年第01期
P. 44

1 期                                     水    产    学    报                                 50 卷


                              10 2       a  ab  ab               ab   a ab  ab      ab ab  a   HK

                                                                                               LV
                          IL-12 相对表达量 relative expression level of IL-12  10 1 0  b  b  b  c  c  ab  bc  ac  a  b  b  b  b  b  SP
                                                                                               TK
                                                                                               MS
                                                                                               HG
                              10


                             10 −1
                                     IL-12p35a     IL-12p40a     IL-12p40b      IL-12p40c
                                                      不同 IL-12 亚基基因
                                                    different IL-12 subunit genes
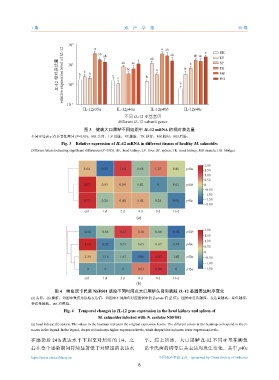
                                     图 3    健康大口黑鲈不同组织中        IL-12 mRNA  的相对表达量
              不同字母表示有显著性差异       (P<0.05)。HK.头肾,LV.肝脏,SP.脾脏,TK.体肾,MS.肌肉,HG.后肠。
                           Fig. 3 Relative expression of IL-12 mRNA in different tissues of healthy M. salmoides
              Different letters indicating significant differences (P<0.05). HK. head kidney, LV. liver, SP. spleen, TK. trunk kidney, MS. muscle, HG. hindgut.

                                                                                        2.00
                                     1.04   0.27    1.64    0.68   1.27    0.86  p40a
                                                                                        1.50
                                                                                        1.00
                                                                                        0.50
                                     0.07   0.03    0.04    0.02    0      0.01  p40b   0
                                                                                        −0.50
                                                                                        −1.00
                                     0.77   0.24    0.44    0.44   0.24    0.06  p40c   −1.50
                                                                                        −2.00
                                     ctrl    1 d    2 d     4 d     8 d    16 d
                                                           (a)


                                     0.04    0.06   0.13    0.10   0.06    0.02  p40b   2.00
                                                                                        1.50
                                                                                        1.00
                                     1.60    0.32   0.51    0.65   0.67    0.39  p40c
                                                                                        0.50
                                                                                        0
                                     2.30    1.16   1.41    0.86   4.07    1.42  p40a   −0.50
                                                                                        −1.00
                                      0       0      0      0.03   0.04     0    p35a   −1.50

                                     ctrl    1 d    2 d     4 d     8 d    16 d
                                                           (b)
                        图 4    鰤鱼诺卡氏菌    NSFS01  感染不同时间点大口黑鲈头肾和脾脏            IL-12  基因表达时序变化
              (a) 头肾;(b) 脾脏;热图中数值为原始表达值,热图中不同颜色对应图例中的             Z-score 值  (Z  值),图例中红色越深,表达量越高。蓝色越深,
              表达量越低。ctrl.对照组。
                            Fig. 4 Temporal changes in IL-12 gene expression in the head kidney and spleen of
                                           M. salmoides infected with N. seriolae NSFS01
              (a) head kidney; (b) spleen; The values in the heatmap represent the original expression levels. The different colors in the heatmap correspond to the Z-
              scores in the legend. In the legend, deeper red indicates higher expression levels, while deeper blue indicates lower expression levels.

              在感染后     24 h  表达水平下调至对照组的            1/4,之      平。综上所述,大口黑鲈             IL-12  不同亚基在鰤鱼
              后在整个感染期间持续显著低于对照组的表达水                            诺卡氏菌的诱导后其表达均发生变化,其中                     p40c

              https://www.china-fishery.cn                           中国水产学会主办    sponsored by China Society of Fisheries
                                                            8
   39   40   41   42   43   44   45   46   47   48   49