Page 87 - 《中国药科大学学报》2026年第2期
P. 87

第  57 卷第  2 期         乔佳男,等:胰腺癌靶向纳米载体的合成、表征及其改善光动力治疗研究                                     213
                      A     ZnPc    Hoechst 33342  Bright field  Merge  B                       Control

                                                                         300                    ZnPc
                                                                                                LL/ZnPc
                  Free ZnPc                                              200                    PTP+LL-PTP/ZnPc
                                                                        Count                   LL-PTP/ZnPc
                                                                         100

                   LL/ZnPc                                                 0 10 1  10 2  10 3  10 4  10 5
                                                                                R1-A::APC-A
                                                                     C          ***
                                                                       60 000                   LL-PTP/ZnPc
                                                                                                PTP+LL-PTP/ZnPc
                                                                      MFI of ZnPc  20 000       ZnPc
                LL-PTP/ZnPc                                            40 000          ***      LL/ZnPc
                                                                                                Control

                                                                           0
                                                                          PTP+LL-PTP/ZnPc
                                                                         LL-PTP/ZnPc
                PTP+LL-PTP                                                         LL/ZnPc  ZnPc  Control
                     /ZnPc


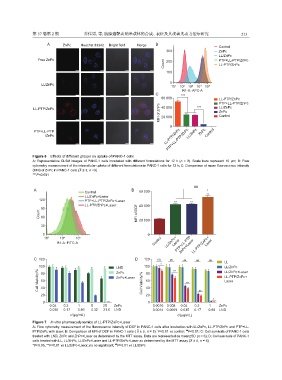
               Figure 6    Effects of different groups on uptake of PANC-1 cells
               A: Representative CLSM images of PANC-1 cells incubated with different formulations for 12 h (n = 3). Scale bars represent 10 μm; B: Flow
               cytometry measurement of the intracellular uptake of different formulations in PANC-1 cells for 12 h; C: Comparison of mean fluorescence intensity
               (MFI) of ZnPc in PANC-1 cells ( x ± s, n =3)
               ***P<0.001

                                                                                     ##

                A                                         B
                                      Control                60 000
                                      LL/ZnPc+Laser                                        **
                  120                 PTP+LL-PTP/ZnPc+Laser                  **     **
                                      LL-PTP/ZnPc+Laser      40 000
                  Count 90                                   MFI of DCF
                   60

                   30                                        20 000
                    0                                            0
                    10 3   10 4   10 5
                                                                               ZnPc+Laser
                          B1-A::FITC-A                              Control  LL/ZnPc+ Laser PTP+LL-PTP  LL-PTP/ZnPc+ Laser


                C  120                                      D   120  ns    ##    ##   ##    ##    LL
                  100                              LND          100    *    **                    LL/ZnPc
                  Cell Viability/%  60             ZnPc+Laser  Cell Viability/%  60  **           LL-PTP/ZnPc+
                                                                                                  LL/ZnPc+Laser
                                                   ZnPc
                   80
                                                                80
                                                                                                  Laser
                   40
                                                                20
                   20                                           40                     **
                                                                                             *
                    0                                            0
                       0.04  0.2   1     5    25   ZnPc            0.0016 0.008  0.04  0.2  1   ZnPc
                       0.035  0.17  0.86  4.32  21.6  LND          0.0014  0.0069  0.035  0.17  0.86  LND
                               c/(μg/mL)                                      c/(μg/mL)
               Figure 7    In vitro pharmacodynamics of LL-PTP/ZnPc+Laser
               A: Flow cytometry measurement of the fluorescence intensity of DCF in PANC-1 cells after incubation with LL/ZnPc, LL-PTP/ZnPc and PTP+LL-
                                                                     **
                                                                                  ##
               PTP/ZnPc with laser; B: Comparison of MFI of DCF in PANC-1 cells (  x ± s, n = 3). P<0.01 vs control;  P<0.01; C: Cell survivals of PANC-1 cells
               treated with LND, ZnPc and ZnPc+Laser as determined by the MTT assay. Data are represented as mean±SD (n = 6); D: Cell survivals of PANC-1
               cells treated with LL, LL/ZnPc, LL/ZnPc+Laser and LL-PTP/ZnPc+Laser as determined by the MTT assay ( x ± s, n = 6)
                                                   ##
               *P<0.05, **P<0.01 vs LL/ZnPc+Laser; ns no significant;  P<0.01 vs LL/ZnPc
   82   83   84   85   86   87   88   89   90   91   92