
Page 135 - 《中国药科大学学报》2026年第2期
P. 135
第 57 卷第 2 期 张 靖,等:齐多夫定通过促进脂肪酸氧化改善高脂饮食诱导的大鼠代谢紊乱 261
A 15 B 1 500 C 5
Serum glucose /(mmol/L) 10 5 AUC of serum glucose /(mmol·min/L) 1 000 Fasting serum glucose /(mmol/L) 4 3 2
500
0 0 1 0
AZT (50 mg/kg)
AZT (50 mg/kg)
0 15 30 60 120 HFD HFD
Time after glucose administration/min Control Control
Control AZT (25 mg/kg) AZT (25 mg/kg) AZT (25 mg/kg)
HFD AZT (50 mg/kg)
D E F
4 400 4
300
Serum lactate /(mmol/L) 3 2 AUC of serum lactate /(mmol·min/L) 200 Fasting serum lactate /(mmol/L) 3 2 1
100
0 1 0 0
AZT (50 mg/kg)
AZT (50 mg/kg)
0 15 30 60 120 HFD HFD
Time after glucose administration/min Control AZT (25 mg/kg) Control AZT (25 mg/kg)
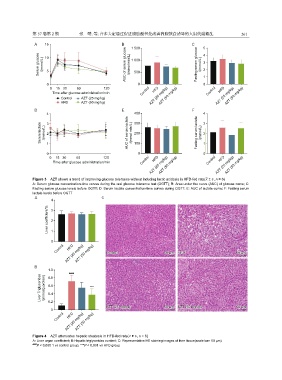
Figure 3 AZT shows a trend of improving glucose tolerance without inducing lactic acidosis in HFD-fed rats( x ± s, n = 6)
A: Serum glucose concentration-time curves during the oral glucose tolerance test (OGTT); B: Area under the curve (AUC) of glucose curve; C:
Fasting serum glucose levels before OGTT; D: Serum lactate concentration-time curves during OGTT; E: AUC of lactate curve; F: Fasting serum
lactate levels before OGTT
A C
4
Liver coefficient/% 3 2
0 1
AZT (50 mg/kg)
HFD
Control AZT (25 mg/kg) Control 50 μm HFD 50 μm
B
1.0
####
Liver Triglycerides /(mmol/g protein) 0.6 ***
0.8
0.4
0.2
AZT (25 mg/kg) 50 μm AZT (50 mg/kg) 50 μm
0
HFD
Control AZT (25 mg/kg)
AZT (50 mg/kg)
Figure 4 AZT attenuates hepatic steatosis in HFD-fed rats( x ± s, n = 6)
A: Liver organ coefficient; B:Hepatic triglycerides content; C: Representative HE staining images of liver tissue(scale bar: 50 μm)
####
P < 0.000 1 vs control group; ***P < 0.001 vs HFD group