Page 76 - 《中国药科大学学报》2025年第5期
P. 76

608                      学报   Journal of China Pharmaceutical University 2025, 56(5): 601 − 612  第 56 卷

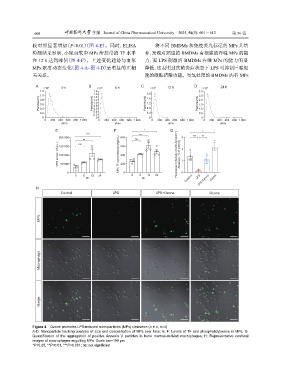
               较对照显著增加(P<0.01)(图           4-E)。同时,ELISA             将不同   BMDMs 和免疫荧光标记的            MPs 共培
               检测结果显示,小鼠血浆中             MPs 所携带的     TF  水平     养,发现对照组的 BMDMs 有很强的吞噬                MPs 的能
               在  12 h 达到峰值(图      4-F)。上述变化趋势与血浆               力,而   LPS  刺激后   BMDMs 吞噬     MPs 的能力明显
               MPs 浓度动态变化(图         4-A~图  4-D)呈明显的正相           降低,这表明过度的炎症状态下               LPS  可抑制巨噬细
               关关系。                                             胞的微粒清除功能。臭氧处理的               BMDMs 内吞    MPs

                 A  ×10 6   0 h         B  ×10 6   6 h         C   ×10 7  12 h        D  ×10 6   24 h

                  1.2                     1.8                                           3.0
                  1.0                     1.6                    2.0                    2.5
                                          1.4
                  Particles/mL  0.8      Particles/mL  1.2       Particles/mL  1.2     Particles/mL  2.0
                                                                 1.6
                                          1.0
                  0.6
                                                                                        1.5
                                          0.8
                                                                 0.8
                  0.4
                                          0.4
                  0.2                     0.6                    0.4                    1.0
                                                                                        0.5
                                          0.2
                   0                       0                      0                      0
                    0  200  400  600  800 1 000  0  200  400  600  800 1 000  0  200  400  600  800 1 000  0  200  400  600  800 1 000
                            d/nm                   d/nm                   d/nm                   d/nm
                         E                         F            *          G             *
                                       ns                    ***
                           200 000                    800                       3    ***  **
                                     **               600   ns
                          MPs annexi V/(a.u.)  100 000  MPs TF concentration/(ng/mL)  400  Fluorescent intensity of anti-Annexin V  Area/(a.u. % of control)  2 1
                                   ns
                           150 000
                           50 000
                              0                       200 0                     0
                                  0  6   12  24           0   6  12  24                LPS
                                      t/h                      t/h                Comtrol  LPS+Ozone  Ozone
                 H
                            Control               LPS                LPS+Ozone              Ozone

                  MPs


                  Macrophage


                  Merge


               Figure 4    Ozone promotes LPS-induced microparticles (MPs) clearance ( x ± s, n=4)
               A-D: Nanoparticle tracking analysis of size and concentration of MPs over time; E, F: Levels of TF and phosphatidylserine in MPs; G:
               Quantification  of  the  aggregation  of  positive  Annexin  V  particles  in  bone  marrow-derived  macrophages;  H:  Representative  confocal
               images of macrophages engulfing MPs. Scale bar=100 μm
               *P<0.05, **P<0.01, ***P<0.001; ns: not significant
   71   72   73   74   75   76   77   78   79   80   81