
Page 195 - 《振动工程学报》2026年第5期
P. 195
第 5 期 王振宇,等:视觉振动测量的稀疏传感方法研究 1399
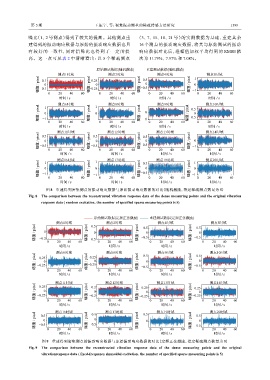
噪比(1、2 号测点)得到了较大的提高。其他测点重 (3、7、15、18、21 号)的实测数据为基础,重建其余
建得到的振动响应数据与原始的振动响应数据也具 16 个测点的振动响应数据,将其与原始测试的振动
有 较 好 的 一 致 性, 同 时 信 噪 比 也 得 到 了 一 定 的 提 响应数据对比后,经幅值加权平均得到的 RMSE 依
高。这一点可从表 2 中清晰看出:以 5 个稀疏测点 次为 11.79%、7.97% 和 7.08%。
原始测试数据(随机激励) 重建测试数据(随机激励)
测点1时域 测点2时域 测点4时域 1 测点5时域
幅值 / pixel −0.1 0 幅值 / pixel −0.25 0 幅值 / pixel −0.5 0 幅值 / pixel −1 0
0.5
0.25
0.1
20
0
时间 / s
时间 / s
时间 / s
时间 / s 40 60 0 20 40 60 0 20 40 60 0 20 40 60
测点6时域 1 测点8时域 测点9时域 测点10时域
幅值 / pixel −1 0 幅值 / pixel 0 幅值 / pixel −1 0 幅值 / pixel −0.5 0
1
0.5
20
0
时间 / s
时间 / s 40 60 0 20 40 60 0 20 40 60 0 20 40 60
时间 / s
时间 / s
测点11时域 0.5 测点12时域 测点13时域 测点14时域
幅值 / pixel −0.5 0 幅值 / pixel −0.5 0 幅值 / pixel −0.5 0 幅值 / pixel −1 0
0.5
0.5
0
20
40
时间 / s 40 60 0 20 时间 / s 40 60 0 20 时间 / s 40 60 0 20 时间 / s 60
测点16时域 1 测点17时域 0.5 测点19时域 1 测点20时域
幅值 / pixel 0 幅值 / pixel 0 幅值 / pixel −0.5 0 幅值 / pixel 0
1
−1
0 20 40 60 −1 0 20 40 60 0 20 40 60 −1 0 20 40 60
时间 / s 时间 / s 时间 / s 时间 / s
图 8 重建得到密集测点的振动响应数据与原始振动响应数据的对比(随机激励,指定稀疏测点数量为 5)
Fig. 8 The comparison between the reconstructed vibration response data of the dense measuring points and the original vibration
response data ( random excitation,the number of specified sparse measuring points is 5)
原始测试数据(定频正弦激励) 重建测试数据(定频正弦激励)
测点1时域 0.5 测点2时域 0.5 测点4时域 0.5 测点5时域
幅值 / pixel 0 幅值 / pixel 0 幅值 / pixel −0.5 0 幅值 / pixel −0.5 0
−0.2
0 20 40 60 −0.5 0 20 40 60 0 20 40 60 0 20 40 60
时间 / s 时间 / s 时间 / s 时间 / s
测点6时域 测点8时域 0.5 测点9时域 0.5 测点10时域
幅值 / pixel −0.25 0 幅值 / pixel −0.25 0 幅值 / pixel 0 幅值 / pixel −0.5 0
0.25
0.25
0 20 40 60 0 20 40 60 −0.5 0 20 40 60 0 20 40 60
时间 / s 时间 / s 时间 / s 时间 / s
测点11时域 测点12时域 测点13时域 测点14时域
幅值 / pixel −0.25 0 幅值 / pixel −0.2 0 幅值 / pixel −0.25 0 幅值 / pixel −0.25 0
0.25
0.2
0.25
0.25
20
0
40
40
时间 / s
时间 / s 60 0 20 40 60 0 20 40 60 0 20 时间 / s 60
时间 / s
测点16时域 0.5 测点17时域 0.5 测点19时域 0.5 测点20时域
幅值 / pixel −0.5 0 幅值 / pixel −0.5 0 幅值 / pixel 0 幅值 / pixel −0.5 0
0.5
0
40
20
时间 / s
时间 / s 60 0 20 40 60 0 20 40 60 0 20 时间 / s 40 60
时间 / s
图 9 重建得到密集测点的振动响应数据与原始振动响应数据的对比(定频正弦激励,指定稀疏测点数量为 5)
Fig. 9 The comparison between the reconstructed vibration response data of the dense measuring points and the original
vibrationresponse data ( fixed-frequency sinusoidal excitation,the number of specified sparse measuring points is 5)