
Page 94 - 卫星导航2021年第1-2合期
P. 94
Shi et al. Satell Navig (2021) 2:5 Page 10 of 13
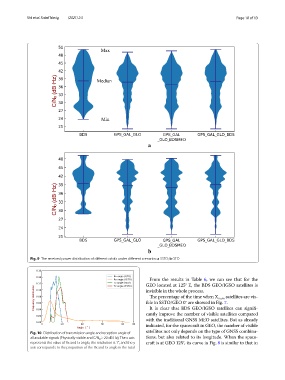
Max
C/N(dB·Hz) Median
Min
a
(dB·Hz)
C/N
b
Fig. 9 The received power distribution of diferent orbits under diferent scenarios: a SSTO; b GEO
From the results in Table 6, we can see that for the
GEO located at 125° E, the BDS GEO/IGSO satellites is
Frequency distribution ible in SSTO/GEO 0° are showed in Fig. 7.
invisible in the whole process.
Te percentage of the time when X
satellites are vis-
num
It is clear that BDS GEO/IGSO satellites can signif-
cantly improve the number of visible satellites compared
with the traditional GNSS MEO satellites. But as already
indicated, for the spacecraft in GEO, the number of visible
Angle °
Fig. 10 Distribution of transmission angle and reception angle of satellites not only depends on the type of GNSS combina-
all available signals (Physically visible and C/N > 20 dB·Hz), The x axis tions, but also related to its longitude. When the space-
0
represents the value of Rx and Tx angle, the resolution is 1°, and the y craft is at GEO 125°, its curve in Fig. 8 is similar to that in
axis corresponds to the proportion of the Rx and Tx angle in the total