
Page 95 - 卫星导航2021年第1-2合期
P. 95
Shi et al. Satell Navig (2021) 2:5 Page 11 of 13
Cumulative distribution function Cumulative distribution function at 0°
at 125°
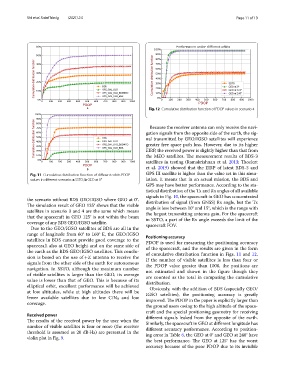
PDOP at 240°
PDOP
a Fig. 12 Cumulative distribution function of PDOP values in scenario 4
Cumulative distribution function gation signals from the opposite side of the earth, the sig-
Because the receiver antenna can only receive the navi-
nal transmitted by GEO/IGSO satellites will experience
greater free space path loss. However, due to its higher
EIRP, the received power is slightly higher than that from
the MEO satellites. Te measurement results of BDS-3
satellites in testing (Ramakrishnan et al. 2013; Toelert
PDOP et al. 2019) showed that the EIRP of latest BDS-3 and
b
Fig. 11 Cumulative distribution function of diferent orbits PDOP GPS III satellite is higher than the value set in this simu-
values in diferent scenario: a SSTO; b GEO at 0° lation. It means that in an actual mission, the BDS and
GPS may have better performance. According to the sta-
tistical distribution of the Tx and Rx angles of all available
signals in Fig. 10, the spacecraft in GEO has concentrated
the scenario without BDS GEO/IGSO where GEO at 0°. distribution of signal (from GNSS) Rx angle, but the Tx
Te simulation result of GEO 125° shows that the visible angle is less between 10° and 15°, which is the range with
satellites in scenario 3 and 4 are the same which means the largest transmitting antenna gain. For the spacecraft
that the spacecraft in GEO 125° is not within the beam in SSTO, a part of the Rx angle exceeds the limit of the
coverage of any BDS GEO/IGSO satellite. spacecraft FOV.
Due to the GEO/IGSO satellites of BDS are all in the
range of longitude from 60° to 160° E, the GEO/IGSO Positioning accuracy
satellites in BDS cannot provide good coverage to the PDOP is used for measuring the positioning accuracy
spacecraft also at GEO height and on the same side of of the spacecraft, and the results are given in the form
the earth as the BDS GEO/IGSO satellites. Tis conclu- of cumulative distribution function in Figs. 11 and 12.
sion is based on the use of +Z antenna to receive the If the number of visible satellites is less than four or
signals from the other side of the earth for autonomous the PDOP value greater than 1000, the positions are
navigation. In SSTO, although the maximum number not estimated and shown in the fgure though they
of visible satellites is larger than the GEO, its average are counted as the total in computing the cumulative
value is lower than that of GEO. Tis is because of its distribution.
elliptical orbit, excellent performance will be achieved Obviously, with the addition of BDS (especially GEO/
at low altitudes, while at high altitudes there will be IGSO satellites), the positioning accuracy is greatly
fewer available satellites due to low C/N 0 and low improved. Te PDOP in the paper is explicitly larger than
coverage.
the ground users owing to the high altitude of the space-
craft and the special positioning geometry for receiving
Received power diferent signals leaked from the opposite of the earth.
Te results of the received power by the user when the Similarly, the spacecraft in GEO at diferent longitude has
number of visible satellites is four or more (the receiver diferent accuracy performance. According to position-
threshold is assumed as 20 dB·Hz) are presented in the ing error in Table 6, the GEO at 0° and GEO at 240° have
violin plot in Fig. 9.
the best performance. Te GEO at 125° has the worst
accuracy because of the poor PDOP due to its invisible