
Page 92 - 卫星导航2021年第1-2合期
P. 92
Shi et al. Satell Navig (2021) 2:5 Page 8 of 13
num )
Percentage of time (≥X
X num
a
num )
Percentage of time (≥X
X
num
b
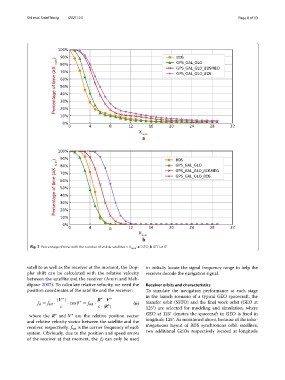
Fig. 7 Percentage of time with the number of visible satellites ≥ X num : a SSTO; b GEO at 0°
satellite as well as the receiver at the moment, the Dop- to initially locate the signal frequency range to help the
pler shift can be calculated with the relative velocity receiver decode the navigation signal.
between the satellite and the receiver (Amiri and Meh-
dipour 2007). To calculate relative velocity, we need the Receiver orbits and characteristics
position coordinates of the satellite and the receiver: To simulate the navigation performance at each stage
in the launch scenario of a typical GEO spacecraft, the
∗ ∗ ∗
|V | R · V transfer orbit (SSTO) and the fnal work orbit (GEO at
∗
f d = f sat · · cos θ = f sat · (6)
∗
c c ·|R | 125°) are selected for modeling and simulation, where
where the R and V are the relative position vector GEO at 125° denotes the spacecraft in GEO is fxed in
∗
∗
and relative velocity vector between the satellite and the longitude 125°. As mentioned above, because of the inho-
receiver, respectively, f sat is the carrier frequency of each mogeneous layout of BDS synchronous orbit satellites,
system. Obviously, due to the position and speed errors two additional GEOs respectively located at longitude
of the receiver at that moment, the f d can only be used