
Page 79 - 卫星导航2021年第1-2合期
P. 79
Cheng et al. Satell Navig (2021) 2:2 Page 7 of 12
of any GNSS stations at the observation epoch to the stations (Cheng at al. 2020). More specifcally, the veloci-
CGCS2000 frame. ties for all the stations in each of the 20 subplates were
A gridded horizontal velocity feld is constructed using interpolated with the above fve methods. Te method
an interpolation method, but diferent methods perform that achieved the highest accuracy was regarded as the
diferently. In this study, we aim at the selection of an optimal one and was employed to construct the grid-
optimal method. Five interpolation methods were tested, ded velocity feld. For the detailed information on the 20
including Inverse Distance Weighting (IDW), Block Euler subplates, one can refer to China Plate Model (CPM) for
Vector (BEV), Least Squares Collocation (LSC), Local CGCS2000 (CPM-CGCS2000) (Cheng et al. 2013). Te
Euler Vector (LEV) and Finite Element (FE), using the CPM-CGCS2000 was developed for the maintenance of
velocity components at the aforementioned 1025 GNSS the CGCS2000 dynamic reference frame. Table 4 gives
the 20 subplates or blocks.
Te velocities interpolated with each of the fve
selected methods at all stations in each subplate were
validated using the cross-validation method, referring to
Table 4 Information on 20 subplates, and the stations
in the last column were selected for testing (Chen 2013) for the detailed information. Te Root Mean
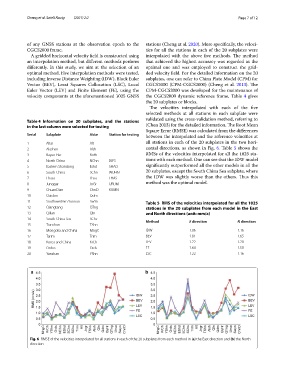
Square Error (RMSE) was calculated from the diferences
Serial Subplate Abbr Station for testing between the interpolated and the reference velocities at
1 Altai Alt all stations in each of the 20 subplates in the two hori-
2 Alashan Alsh zontal directions, as shown in Fig. 6. Table 5 shows the
3 Bayan Har BnHr RMSs of the velocities interpolated for all the 1025 sta-
4 North China NChn BJFS tions with each method. One can see that the IDW model
5 Eastern Shandong Eshd SHAO signifcantly outperformed all the other models in all the
6 South China SChn WUHN 20 subplates, except the South China Sea subplate, where
7 Lhasa Lhsa LHAS the IDW was slightly worse than the others. Tus this
8 Junggar JnGr URUM method was the optimal model.
9 ChuanDian ChnD KUMN
10 Qaidam Qdm
11 Southwestern Yunnan SwYn Table 5 RMS of the velocities interpolated for all the 1025
12 Qiangtang QTng stations in the 20 subplates from each model in the East
13 Qilian Qln and North directions (unit: mm/a)
14 South China Sea SChs Method E direction N direction
15 Tianshan TShn
16 Mongolia and China MngC IDW 1.06 1.16
17 Tarim Trim BEV 1.81 1.65
18 Korea and China KrCh LEV 1.22 1.20
19 Ordos Ords FE 1.64 1.58
20 Yanshan YShn LSC 1.22 1.16
Fig. 6 RMSE of the velocities interpolated for all stations in each of the 20 subplates from each method in (a) the East direction and (b) the North
direction