
Page 82 - 卫星导航2021年第1-2合期
P. 82
Cheng et al. Satell Navig (2021) 2:2 Page 10 of 12
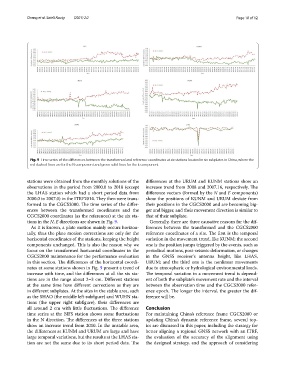
Fig. 9 Time series of the diferences between the transformed and reference coordinates at six stations located in six subplates in China, where the
red dashed lines are for the N component and green solid lines for the E component
stations were obtained from the monthly solutions of the diferences at the URUM and KUNM stations show an
observations in the period from 2000.0 to 2018 (except increase trend from 2008 and 2007.16, respectively. Te
the LHAS station which had a short period data from diference vectors (formed by the N and E components)
2000.0 to 2007.0) in the ITRF2014. Tey then were trans- show the positions of KUNM and URUM deviate from
formed to the CGCS2000. Te time series of the difer- their positions in the CGCS2000 and are becoming big-
ences between the transformed coordinates and the ger and bigger, and their movement direction is similar to
CGCS2000 coordinates (as the references) at the six sta- that of their subplate.
tions in the N, E directions are shown in Fig. 9. Generally, there are three causative reasons for the dif-
As it is known, a plate motion mainly occurs horizon- ferences between the transformed and the CGCS2000
tally, thus the plate motion corrections are only for the reference coordinates of a site. Te frst is the temporal
horizontal coordinates of the stations, keeping the height variation in the movement trend, like KUNM; the second
components unchanged. Tis is also the reason why we one is the position jumps triggered by the events, such as
focus on the transformed horizontal coordinates in the periodical motions, post-seismic deformation, or changes
CGCS2000 maintenance for the performance evaluation in the GNSS receiver’s antenna height, like LHAS,
in this section. Te diferences of the horizontal coordi- URUM; and the third one is the nonlinear movements
nates at some stations shown in Fig. 9 present a trend of due to atmospheric or hydrological environmental loads.
increase with time, and the diferences at all the six sta- Te temporal variation in a movement trend is depend-
tions are in the range about 2–3 cm. Diferent stations ent of both the subplate’s movement rate and the interval
at the same time have diferent corrections as they are between the observation time and the CGCS2000 refer-
in diferent subplates. At the sites in the stable area, such ence epoch. Te longer the interval, the greater the dif-
as the SHAO (the middle left subfgure) and WUHN sta- ference will be.
tions (the upper right subfgure), their diferences are
all around 2 cm with little fuctuations. Te diference Conclusion
time series at the BJFS station shows some fuctuations For maintaining China’s reference frame CGCS2000 or
in the N direction. Te diferences at the three stations updating China’s dynamic reference frame, several top-
show an increase trend from 2010. In the unstable area, ics are discussed in this paper, including the strategy for
the diferences at KUNM and URUM are large and have better aligning a regional GNSS network with an ITRF,
large temporal variations, but the results at the LHAS sta- the evaluation of the accuracy of the alignment using
tion are not the same due to its short period data. Te the designed strategy, and the approach of considering