
Page 76 - 卫星导航2021年第1-2合期
P. 76
Cheng et al. Satell Navig (2021) 2:2 Page 4 of 12
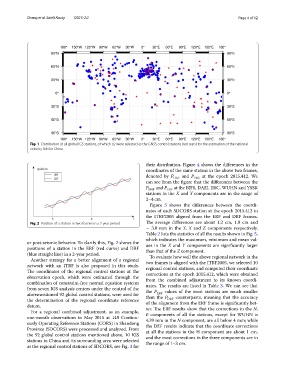
Fig. 1 Distribution of all global IGS stations, of which 92 were selected as the GNSS control stations (red stars) for the estimation of the national
velocity feld in China
their distribution. Figure 4 shows the diferences in the
coordinates of the same station in the above two frames,
denoted by P DRF and P ERF, at the epoch 2015.412. We
can see from the fgure that the diferences between the
P DRF and P ERF at the BJFS, DAEJ, IISC, WUHN and YSSK
stations in the X and Y components are in the range of
2–4 cm.
Figure 5 shows the diferences between the coordi-
nates of each SDCORS station at the epoch 2015.412 in
the ITRF2005 aligned from the ERF and DRF frames.
Fig. 2 Position of a station in two frames in a 2-year period Te average diferences are about 1.2 cm, 1.0 cm and
− 3.0 mm in the Y, X and Z components respectively.
Table 2 lists the statistics of all the results shown in Fig. 5,
which indicates the maximum, minimum and mean val-
or post-seismic behavior. To clarify this, Fig. 2 shows the ues in the X and Y components are signifcantly larger
positions of a station in the ERF (red curve) and DRF than that of the Z component.
(blue straight line) in a 2-year period. To evaluate how well the above regional network in the
Another strategy for a better alignment of a regional
network with an ITRF is also proposed in this study. two frames is aligned with the ITRF2005, we selected 10
regional control stations, and computed their coordinate
Te coordinates of the regional control stations at the corrections at the epoch 2015.412, which were obtained
observation epoch, which were estimated through the from the combined adjustment to its known coordi-
combination of constraint-free normal equation systems nates. Te results are listed in Table 3. We can see that
from seven IGS analysis centers under the control of the the P values of the most stations are much smaller
ERF
aforementioned 92 global control stations, were used for than the P counterparts, meaning that the accuracy
DRF
the determination of the regional coordinate reference of the alignment from the ERF frame is signifcantly bet-
datum. ter. Te ERF results show that the corrections in the N,
For a regional combined adjustment, as an example,
one-month observations in May 2015 at 148 Continu- E components of all the stations, except for WUHN is
4.39 mm in the N component, are all below 4 mm; while
ously Operating Reference Stations (CORS) in Shandong the DEF results indicate that the coordinate corrections
Province (SDCORS) were processed and analyzed. From at all the stations in the H component are about 1 cm,
the 92 global control stations mentioned above, 10 IGS and the most corrections in the three components are in
stations in China and its surrounding area were selected the range of 1–3 cm.
as the regional control stations of SDCORS, see Fig. 3 for