Page 179 - 《水产学报》2026年第3期
P. 179

3 期                                     水    产    学    报                                 50 卷
                         对照组 Control               低添加组 Low Fe 2 O 3  NPs       高添加组 High Fe 2 O 3  NPs


                                       20 μm                       20 μm                        20 μm
                                                           (a)

                                                                   对照组       低添加组          高添加组
                       对照组      低添加组          高添加组                 Control   Low Fe 2 O 3  NPs  High Fe 2 O 3  NPs
                       Control  Low Fe 2 O 3  NPs  High Fe 2 O 3  NPs
                                                             25
                         3 000  a                            20
                     肌纤维密度/(个/mm 2 )  muscle fiber density  2 500  b  c  分布频率/%  relative frequency  15


                                                             10
                         2 000
                                                              5
                                                              0
                         1 500                                      0   8   16   24  32   40  48
                                    组别                                     肌纤维直径/μm
                                   groups                                muscle fiber diameter
                                     (b)                                         (c)

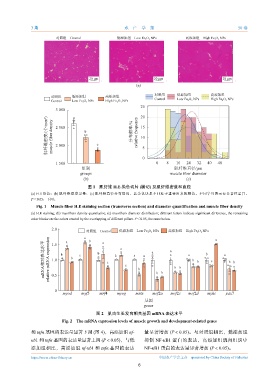
                                      图 1    肌纤维  H.E  染色切片  (横切) 及肌纤维密度和直径
              (a) H.E  染色;(b) 肌纤维密度定量;(c) 肌纤维直径分布情况,其余色块是不同柱子重叠出来的颜色。不同字母表示有显著性差异,
              P<0.05,下同。
                 Fig. 1 Muscle fiber H.E staining section (transverse section) and diameter quantification and muscle fiber density
              (a) H.E staining; (b) myofibers density quantitative; (c) myofibers diameter distribution; different letters indicate significant difference, the remaining
              color blocks are the colors created by the overlapping of different pillars. P<0.05, the same below.
                       2.0   a       a 对照组 Control  低添加组 Low Fe 2 O 3  NPs  高添加组             a

                                                                                High Fe 2 O 3  NPs
                                       b
                                             a
                    mRNA相对表达水平 relative mRNA expression  1.0  b  b  c  b  c  b  a  c  a  b  a  a  b b  a  b  b  a  b  b  b  c  a  b b
                       1.5


                       0.5


                        0
                            myod    myf5   mrf4    myog    mstn   mef2a   mef2c  mef2d   myhc    pax7
                                                               基因
                                                              genes

                                          图 2    肌肉生长发育相关基因       mRNA  表达水平
                            Fig. 2 The mRNA expression levels of muscle growth and development-related genes

              和  tnfα 基因的表达量显著下调         (图  4),高添加组    nf-    量显著增加      (P<0.05)。与对照组相比,低添加组
              κb1  和  tnfα  基因的表达量显著上调      (P<0.05),与低        抑制 NF-κB1 蛋白的表达,高添加组肌肉组织中
              添加组相比,高添加组            nf-κb1  和  tnfα  基因的表达     NF-κB1 蛋白的表达量显著增加           (P<0.05)。

              https://www.china-fishery.cn                           中国水产学会主办    sponsored by China Society of Fisheries
                                                            6
   174   175   176   177   178   179   180   181   182   183   184