Page 49 - 《中国药科大学学报》2026年第1期
P. 49

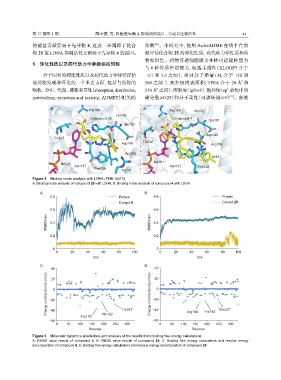
第  57 卷第  1 期               邴天德,等:乳酸脱氢酶       A  抑制剂的设计、合成与生物活性                             43

               的能量贡献要弱于先导物             4,这进一步阐释了化合              参数 。本研究中,使用            SwissADME  在线平台预
                                                                    [21]
               物  25 在  LDHA  抑制活性方面弱于先导物           4 的原因。      测评估化合物       25 的理化性质、药代动力学性质和药
                                                                物相似性。药物穿透细胞膜并在体内运输的能力
                5    理化性质以及药代动力学参数模拟预测
                                                                与  6 种性质密切相关,包括亲脂性(XLOGP3 介于
                    分子固有的理化性质以及药代动力学特征评估                        −0.7 和  5.0 之间),相对分子质量(M 介于            150 和
                                                                                                 r
               是药物发现和开发的一个重要方面,包括与药物的                           500 之间 ),拓扑极性表面积(TPSA            介于   20 Å 和
                                                                                                          2
                                                                                                    3
                                                                     2
               吸收、分布、代谢、排泄和毒性(absorption, distribution,         130 Å 之间),溶解度(lgS≤6),饱和度(sp 杂化中的
               metabolism, excretion and toxicity, ADMET)相关的    碳分数≥0.25)和分子柔性(可旋转键≤9) 。预测
                                                                                                     [22]

                       A                Arg168                  B          Arg168     His192
                                                    His192
                                        Compound 25                         Compound 4      Glu191
                                                       Glu191

                                                                                           Asp140
                        Thr247
                                                      Asp140   Thr247                        Arg105

                                                        Arg105
                                                                                             Ile141
                           NADH                                     NADH
                                  Asn137                                   Asn137      Pro138
                                          Pro138      Ile141
               Figure 4    Binding mode analysis with LDHA (PDB: 6Q13)
               A: Binding mode analysis of compound 25 with LDHA; B: Binding mode analysis of compound 4 with LDHA

                   A                                            B

                       0.8                           Protein        0.8                           Protein
                                                     Compd.4                                      Compd.25
                       0.6                                          0.6
                     RMSD/nm  0.4                                  RMSD/nm  0.4


                       0.2                                          0.2


                        0                                            0
                         0      20    40     60     80    100         0      20     40    60     80     100
                                          t/ns                                         t/ns
                   C                                            D
                       40                                           40
                     Energy contribution/(kJ/mol)  −20             Energy contribution/(kJ/mol)  −20 0
                                                                    20
                       20
                        0


                      −40
                                                                    −60
                      −60           Arg168   His192   Thr247        −40           Arg168  His192  Thr247
                         0    50   100  150  200  250  300            0    50   100  150  200  250  300
                                        Residue                                      Residue
               Figure 5    Molecular dynamics simulations and analysis of the results from binding free energy calculations
               A:  RMSD  value  results  of  compound  4;  B:  RMSD  value  results  of  compound  25;  C:  Binding  free  energy  calculations  and  residue  energy
               decomposition of compound 4; D: Binding free energy calculations and residue energy decomposition of compound 25
   44   45   46   47   48   49   50   51   52   53   54