
Page 107 - 《中国药科大学学报》2025年第5期
P. 107
第 56 卷第 5 期 刘欣娜,等:基于多组学分析的多囊卵巢综合征生物标志物及其机制 639
3.2 基于血液代谢组学特征的疾病标志物筛选 是,部分代谢物的变化趋势与临床 PCOS 研究结果
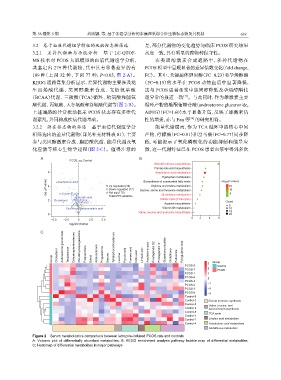
3.2.1 差异代谢物与功能分析 基于 LC-QTOF- 高度一致,具有明显的跨物种保守性。
MS 技术对 PCOS 大鼠模型的血清代谢组学分析, 在类固醇激素合成通路中,多种代谢物在
共鉴定出 279 种代谢物,其中具有显著差异的有 PCOS 模型中呈现显著的差异倍数变化(fold change,
109 种(上调 32 种,下调 77 种;P<0.05, 图 2-A)。 FC)。其中,关键前体胆固醇(FC=0.23)和孕烯醇酮
KEGG 通路富集分析显示,差异代谢物主要涉及花 (FC=0.15)的水平在 PCOS 动物血清中显著降低,
生四烯酸代谢、类固醇激素合成、支链氨基酸 这与 PCOS 患者血浆中胆固醇降低及孕烯醇酮代
[13]
(BCAA)代谢、三羧酸(TCA)循环、精氨酸和脯氨 谢异常的报道一致 。与此同时,作为雄激素主要
酸代谢、丙氨酸、天冬氨酸和谷氨酸代谢等(图 2-B)。 循环产物的雄酮葡糖苷酸(androsterone glucuronide,
上述通路的异常扰动提示 PCOS 状态存在多维代 ADTG)(FC=1.60)水平显著升高,反映了雄激素活
谢紊乱,共同构成疾病代谢基础。 性的增强,亦与 Fan 等 [14] 的研究相符。
3.2.2 潜在标志物的筛选 基于血清代谢组学分 能量代谢层面,作为 TCA 循环中的核心中间
析筛选出的差异代谢物(详见补充材料表 S1),主要 产物,柠檬酸(FC=0.81)和富马酸(FC=0.77)同步降
参与类固醇激素合成、脂肪酸代谢、能量代谢及氧 低,可能提示了氧化磷酸化的功能抑制和能量应
化应激等核心生物学过程(图 2-C)。值得注意的 激,这一代谢特征已在 PCOS 患者血浆中得到多次
A PCOS_vs_Control B
Steroid hormone biosynthesis
Primary bile acid biosynthesis
6 Arachidonic acid metabolism
Tryptophan metabolism −log 10 (P value)
log 10 (P value) 4 Up regulated (32) Glycine, serine and threonine metabolism 15
Biosynthesis of unsaturated fatty acids
Arachidonic acid
Arginine and proline metabolism
Down regulated (77)
10
Not sig (170)
α-Linolenic acid
Fumaric acid Total=279 variables Glutathione metabolism 5
2 Cholesterol Glutathione Citrate cycle (TCA cycle) Count
Citric acid Arginine biosynthesis
Leucine α-Ketoisovaleric acid Vitamin B6 metabolism 5 10
Valine, leucine and isoleucine biosynthesis 15
0 20
0 2 4 6
−5.0 −2.5 0 2.5 5.0
log 2 fold change
C
Group Cholesterol Androsterone glucuronide Testosterone Dehydroepiandrosterone 20α−Dihydroprogesterone Pregnenolone Estriol Adrenosterone Progesterone Estrone Tetrahydrocorticosterone Leucine Pyruvic acid Fumaric acid Citric acid Linoleic acid Arachidonic acid Prostaglandin D2 Prostaglandin I2 Glutathione disulfide Glutathione Putrescine Pyroglutamic acid Group
PCOS-5 3 Control
PCOS-7 2 PCOS
PCOS-1 1
PCOS-6 0
PCOS-4
PCOS-2 −1
PCOS-3 −2
PCOS-8 −3
Control-6
Control-3 Steroid hormone synthesis
Control-5 Valine, leucine, and
Control-2 isoleucineis biosynthesis
Control-8 TCA cycle
Control-1
Control-7 Linoleic acid metabolism
Control-4 Arachidonic acid metabolism
Glutathione metabolism
Figure 2 Serum metabolomics comparison between letrozole-induced PCOS rats and controls
A: Volcano plot of differentially abundant metabolites; B: KEGG enrichment analysis pathway bubble map of differential metabolites;
C: Heat map of differential metabolites in major pathways