
Page 106 - 《中国药科大学学报》2025年第5期
P. 106
638 学报 Journal of China Pharmaceutical University 2025, 56(5): 634 − 644 第 56 卷
A D **** 60 * 10 * 3 **
Testosterone/(pg/mL) 500 Luteinizing hormone/ (mIU/mL) 40 Follicle-stimulating hormone/(IU/L) 8 6 2
400
300
280 200 4 Ratio of luteinizing hormone /follicle-stimulating hormone
Control 20 1
260 PCOS 100 0 0 2 0 0
Weight/g 240 ** 0.5 Control PCOS 10 Control PCOS 200 Control PCOS Control PCOS
****
220
ns
200 0.4 **** 150 **** 60
180 Insulin sensitivity index 0.3 HOMA-IR 8 6 Fasting insulin/(ng/mL) 100 Estradiol/(pmol/L) 80
40
1 3 5 7 9 11 13 15 17 19 21 0.2 4
t/d 0.1 2 50 20
0
Control PCOS 0 Control PCOS 0 Control PCOS 0 Control PCOS
B Proestrus Estrus E Control PCOS
Metestrus Diestrus **** 0.08 **
Ovarian volume/mm 3 200 Ovarian index 0.06
150
0.04
100
50
0.02
0
Control PCOS 0 Control PCOS
C Control F Control
3
Proestrus 15% 2
Estrus 35% Estrous cycles
Metestrus 31% 1
Diestrus 19%
0
1 2 3 4 5 6 7 8 9 10
t/d
Total=80, n=8 1 mm
PCOS PCOS
3
Proestrus 16.3% 2
Estrus 17.5% Estrous cycles
Metestrus 20% 1
Diestrus 46.2%
0
1 2 3 4 5 6 7 8 9 10
t/d
Total=80, n=8
1 mm
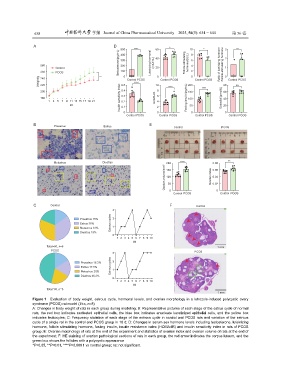
Figure 1 Evaluation of body weight, estrous cycle, hormonal levels, and ovarian morphology in a letrozole-induced polycystic ovary
syndrome (PCOS) rat model ( x±s, n=8)
A: Changes in body weight of rats in each group during modeling; B: Representative pictures of each stage of the estrus cycle of normal
rats, the red box indicates nucleated epithelial cells, the blue box indicates anucleate keratinized epithelial cells, and the yellow box
indicates leukocytes; C: Frequency statistics of each stage of the estrous cycle in control and PCOS rats and variation of the estrous
cycle of a single rat in the control and PCOS group in 10 d; D: Changes in serum sex hormone levels including testosterone, luteinizing
hormone, follicle stimulating hormone, fasting insulin, insulin resistance index (HOMA-IR) and insulin sensitivity index in rats of PCOS
group; E: Ovarian morphology of rats at the end of the experiment and statistics of ovarian index and ovarian volume of rats at the end of
the experiment; F: HE staining of ovarian pathological sections of rats in each group, the red arrow indicates the corpus luteum, and the
green box shows the follicles with a polycystic appearance
*P<0.05, **P<0.01, ****P<0.000 1 vs control group; ns: not significant