Page 90 - 《中国药科大学学报》2025年第4期
P. 90

486                      学报   Journal of China Pharmaceutical University 2025, 56(4): 478 − 487  第 56 卷
                     A  1.5       ROS           B  150        IL-6            C   3         NO

                       Relative fluorescence intensity (ROS)  1.0  pg/mL  90     Concentration/µM  2 1

                                                   120


                                                    60
                        0.5


                          0
                              Control  TP5          30 0                          0
                                                       Control  TP5 (1 μg/mL)       Control  TP5 (1 μg/mL)
                                                       TP5 (0.1 μg/mL)
                                                                TP5 (10 μg/mL)
                                                                                     TP5 (0.1 μg/mL)
                                                                                              TP5 (10 μg/mL)
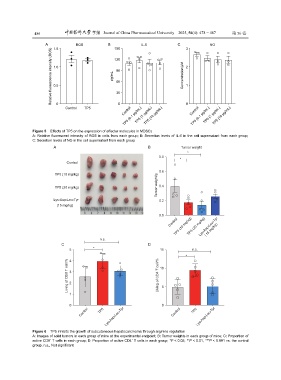
               Figure 5    Effects of TP5 on the expression of effector molecules in MDSCs
               A: Relative fluorescent intensity of ROS in cells from each group; B: Secretion levels of IL-6 in the cell supernatant from each group;
               C: Secretion levels of NO in the cell supernatant from each group
                        A                                         B             Tumor weight

                                                                                   *
                                                                      0.8      *
                              Control
                                                                      0.6
                         TP5 (10 mg/kg)
                                                                     Tumor weight/g  0.4
                         TP5 (20 mg/kg)


                        Lys-Asp-Leu-Tyr                               0.2
                          (15 mg/kg)

                                                                      0.0
                                                                                        Lys-Asp-Leu-Tyr
                                                                           Control TP5 (10 mg/kg) TP5 (20 mg/kg) č15 mg/kgĎ


                                             n.s.
                            C                                     D
                               5          *                            15            n.s.
                                                                                  *
                               4
                              Living of CD8 T cell/%  3 2             Living of CD4 T cell/%  10


                               1                                        5

                               0                                        0
                                    Control  TP5  Lys-Asp-Leu-Tyr           Control  TP5 Lys-Asp-Leu-Tyr


               Figure 6    TP5 inhibits the growth of subcutaneous hepatocarcinoma through arginine regulation
               A: Images of solid tumors in each group of mice at the experimental endpoint; B: Tumor weights in each group of mice; C: Proportion of
                                                          +
                       +
               active CD8  T cells in each group; D: Proportion of active CD4  T cells in each group; *P < 0.05, **P < 0.01, ***P < 0.001 vs. the control
               group. n.s., Not significant
   85   86   87   88   89   90   91   92   93   94   95