Page 9 - 《渔业研究》2026年第1期
P. 9

6                                    渔  业  研  究                                     第 48 卷
                   50  a)                                             1.0  a)  R (0, 0.753),Q (0, −1.055)

                                                                              2
                                                                                         2
                 正交T得分 Orthogonal T score (12.9%)  −25 0          模型的解释率和预测能力的累积值  R 2 Y  cum), Q 2  (cum)  −0.5 0
                   25
                                                                      0.5


                  −50                                                −1.0
                           −40      0       40                       −1.5
                              T 得分 T score (25.4%)                      0     0.25   0.50   0.75   1.00
                                                                                相似性 Similarity  Y, Y perm )
                   40  b)                                             1.0  b)  R (0, 0.756),Q (0, −1.069)
                 正交T得分 Orthogonal T score (7.4%)  −20 0           模型的解释率和预测能力的累积值  R 2 Y  cum), Q 2  (cum)  0.5 0
                                                                              2
                                                                                         2
                   20


                  −40                                                −0.5
                                                                     −1.0
                           −40      0       40
                              T 得分 T score (25.9%)                      0     0.25   0.50   0.75   1.00
                                                                                相似性 Similarity  Y, Y perm )
                   50
                      c)
                 正交T得分 Orthogonal T score (12.2%)  −25 0  组别      模型的解释率和预测能力的累积值  R 2 Y  cum), Q 2  (cum)  0.5 0  数据变异的
                                                                         c)
                                                                             R (0, 0.987),Q (0, −0.488)
                                                                                        2
                                                                             2
                                                                      1.0
                   25
                                                     Group
                                                       A
                                                       B
                                                       C
                                                                                                累积解释率
                                                                                                 2
                                                                                                R Y  cum)
                  −50
                                                                                                 2
                                                                                                Q  (cum)
                           −25      0       25                       −0.5                       累积预测能力
                                                                     −1.0
                              T 得分 T score (10.5%)
                                                                        0     0.25   0.50   0.75   1.00
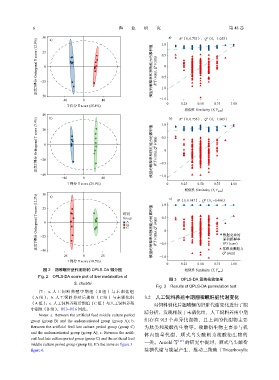
                   图 2    翘嘴鳜肝脏代谢物的     OPLS-DA  得分图                            相似性 Similarity  Y, Y perm )
                 Fig. 2    OPLS-DA score plot of liver metabolites of
                                                                         图 3    OPLS-DA  置换检验结果
                                 S. chuatsi
                                                                    Fig. 3    Results of OPLS-DA permutation test
                  注 : a.  人 工 饲 料 养 殖 中 期 组 ( B  组 ) 与 未 驯 化 组
              (A  组) ;b. 人工饲料养殖后期组(C         组)与未驯化组            3.2 人工饲料养殖中期翘嘴鳜肝脏代谢变化
              (A  组) ;c. 人工饲料养殖后期组(C       组)与人工饲料养殖               对饲料驯化后翘嘴鳜的肝脏代谢变化进行了跟
              中期组(B    组) 。图  3~图  6  同此。
                                                               踪分析,发现相较于未驯化组,人工饲料养殖中期
                  Notes: a. Between the artificial feed middle culture period
              group  (group  B)  and  the  undomesticated  group  (group  A);  b.  组存在  915  个差异代谢物,且上调的代谢物主要
              Between the artificial feed late culture period group (group C)  为肽类和羧酸衍生物等。羧酸衍生物主要参与机
              and the undomesticated group (group A); c. Between the artifi-
                                                               体内能量代谢,顺式乌头酸则为羧酸衍生物的
              cial feed late culture period group (group C) and the artificial feed
                                                               一类。Arnold   等 [17]  的研究中提到,顺式乌头酸衔
              middle culture period group (group B). It’s the same as figure 3−
              figure 6.                                        接糖代谢与能量产生,推动三羧酸(Tricarboxylic
   4   5   6   7   8   9   10   11   12   13   14