
Page 30 - 《运动与健康科学》(英文)2024年第2期
P. 30
TaggedAPTARAEnd152 P.R.P. Nunes et al.
Table 3
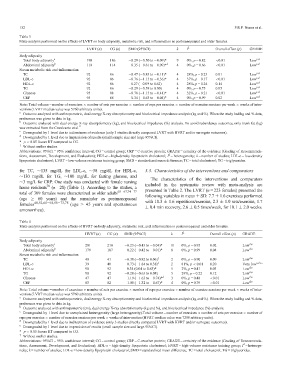
TaggedAPTARACaptionMeta-analysis performed on the effects of LVRT on body adiposity, metabolic risk, and inflammation in postmenopausal and older females. TaggedAPTARAEnd
2
LVRT (n)TaggedAPTARAEnd CG (n)TaggedAPTARAEnd SMD (95%CI)TaggedAPTARAEnd kTaggedAPTARAEnd I TaggedAPTARAEnd Overall effect (p)TaggedAPTARAEnd GRADETaggedAPTARAEndTaggedAPTARAEndTaggedAPTARAEndTaggedAPTARATbody
Body adiposityTaggedAPTARAEnd TaggedAPTARAEnd
a c,d
Total body adiposity TaggedAPTARAEnd 198TaggedAPTARAEnd 186TaggedAPTARAEnd 0.29 (0.50 to 0.09)*TaggedAPTARAEnd 9TaggedAPTARAEnd 0%, p = 0.82TaggedAPTARAEnd <0.01TaggedAPTARAEnd Low TaggedAPTARAEndTaggedAPTARAEnd
b ,y c,d
Abdominal adiposity TaggedAPTARAEnd 118TaggedAPTARAEnd 114TaggedAPTARAEnd 0.35 (0.61 to 0.09)* TaggedAPTARAEnd 4TaggedAPTARAEnd 0%, p = 0.66TaggedAPTARAEnd <0.01TaggedAPTARAEnd Low TaggedAPTARAEndTaggedAPTARAEnd
Serum metabolic risk and inflammationTaggedAPTARAEnd TaggedAPTARAEnd
c,d
TCTaggedAPTARAEnd 92TaggedAPTARAEnd 86TaggedAPTARAEnd 0.47 (0.83 to 0.11)*TaggedAPTARAEnd 4TaggedAPTARAEnd 28%, p = 0.23TaggedAPTARAEnd 0.01TaggedAPTARAEnd Low TaggedAPTARAEndTaggedAPTARAEnd
c,d
LDL-cTaggedAPTARAEnd 92TaggedAPTARAEnd 86TaggedAPTARAEnd 0.76 (1.15 to 0.36)*TaggedAPTARAEnd 4TaggedAPTARAEnd 37%, p = 0.17TaggedAPTARAEnd <0.01TaggedAPTARAEnd Low TaggedAPTARAEndTaggedAPTARAEnd
c,d
HDL-cTaggedAPTARAEnd 92TaggedAPTARAEnd 86TaggedAPTARAEnd 0.27 (0.09 to 0.62)TaggedAPTARAEnd 4TaggedAPTARAEnd 28%, p = 0.24TaggedAPTARAEnd 0.14TaggedAPTARAEnd Low TaggedAPTARAEndTaggedAPTARAEnd
c,d
TGTaggedAPTARAEnd 92TaggedAPTARAEnd 86TaggedAPTARAEnd 0.29 (0.59 to 0.00)TaggedAPTARAEnd 4TaggedAPTARAEnd 0%, p = 0.75TaggedAPTARAEnd 0.05TaggedAPTARAEnd Low TaggedAPTARAEndTaggedAPTARAEnd
c,d
GlucoseTaggedAPTARAEnd 95TaggedAPTARAEnd 88TaggedAPTARAEnd 0.78 (1.15 to 0.41)*TaggedAPTARAEnd 4TaggedAPTARAEnd 32%, p = 0.21TaggedAPTARAEnd <0.01TaggedAPTARAEnd Low TaggedAPTARAEndTaggedAPTARAEnd
c,d
CRPTaggedAPTARAEnd 95TaggedAPTARAEnd 88TaggedAPTARAEnd 0.34 (0.63 to 0.04)*TaggedAPTARAEnd 4TaggedAPTARAEnd 0%, p = 0.99TaggedAPTARAEnd 0.02TaggedAPTARAEnd Low TaggedAPTARAEndTaggedAPTARAEndTaggedAPTARAEnd
Note: Total volume = number of exercises £ number of sets per exercise £ number of reps per exercise £ number of exercise sessions per week £ weeks of inter-
vention (LVRT median value was 5760 arbitrary units).TaggedAPTARAEnd
a
Outcome analyzed with anthropometric, dual energy X-ray absorptiometry and bioelectrical impedance analysis (kg and %). When the study had kg and % data,
preference was given to data in kg.
b
Outcome analyzed with dual energy X-ray absorptiometry (kg), and bioelectrical impedance (%) analysis. To avoid redundancy outcomes, only trunk fat (kg)
62
was extracted from the Cavalcante et al.
c
Downgraded by 1 level due to indirectness of evidence (only 3 studies directly compared LVRT with HVRT and/or surrogate outcomes).
d
Downgraded by 1 level due to imprecision of results (small sample size and large 95%CI).
* p < 0.05 favors RT compared to CG.
y
Without outlier studies.
Abbreviations: 95%CI = 95% confidence interval; CG = control group; CRP = C-reactive protein; GRADE = certainty of the evidence (Grading of Recommenda-
2
tions, Assessment, Development, and Evaluation); HDL-c = high-density lipoprotein cholesterol; I = heterogeneity; k = number of studies; LDL-c = low-density
lipoprotein cholesterol; LVRT = low-volume resistance training group; SMD = standardized mean difference; TC = total cholesterol; TG = triglycerides.
for TC, »135 mg/dL for LDL-c, »58 mg/dL for HDL-c, TaggedAPTARAH23.3. Characteristics of the interventions and comparatorsTaggedAPTARAEnd
»130 mg/dL for TG, »100 mg/dL for fasting glucose, and
TaggedAPTARAPThe characteristics of the interventions and comparators
»3 mg/L for CRP. One study was conducted with female nursing included in the systematic review with meta-analysis are
home residents 78 (n = 20) (Table 1). According to the studies, a presented in Table 2. The LVRT (n = 223 females) presented the
total of 309 females were characterized as older adults 6567,7477
following variables in mean § SD: 7.7 § 1.6 exercises performed
(age 60 years) and the remainder as postmenopausal with 10.3 § 1.6 repetitions/exercise, 2.3 § 1.0 sets/exercise, 1.7
females 48,52,6164,6873,78 (age 45 years and spontaneous
§ 0.4 min recovery, 2.6 § 0.5 times/week, for 10.1 § 2.0 weeks.
amenorrhea).TaggedAPTARAEnd
Table 4
TaggedAPTARACaptionMeta-analysis performed on the effects of HVRT on body adiposity, metabolic risk, and inflammation in postmenopausal and older females. TaggedAPTARAEnd
2
HVRT (n)TaggedAPTARAEnd CG (n)TaggedAPTARAEnd SMD (95%CI)TaggedAPTARAEnd kTaggedAPTARAEnd I TaggedAPTARAEnd Overall effect (p)TaggedAPTARAEnd GRADETaggedAPTARAEndTaggedAPTARAEndTaggedAPTARAEndTaggedAPTARATbody
Body adiposityTaggedAPTARAEnd TaggedAPTARAEnd
a d,e
Total body adiposity TaggedAPTARAEnd 201TaggedAPTARAEnd 210TaggedAPTARAEnd 0.23 (0.43 to 0.04)*TaggedAPTARAEnd 11TaggedAPTARAEnd 0%, p = 0.95TaggedAPTARAEnd 0.02TaggedAPTARAEnd Low TaggedAPTARAEndTaggedAPTARAEnd
b d,e
Abdominal adiposity TaggedAPTARAEnd 179TaggedAPTARAEnd 187TaggedAPTARAEnd 0.22 (0.42 to 0.01)*TaggedAPTARAEnd 8TaggedAPTARAEnd 0%, p = 0.99TaggedAPTARAEnd 0.04TaggedAPTARAEnd Low TaggedAPTARAEndTaggedAPTARAEnd
Serum metabolic risk and inflammationTaggedAPTARAEnd TaggedAPTARAEnd
y d,e
TCTaggedAPTARAEnd 40TaggedAPTARAEnd 41TaggedAPTARAEnd 0.38 (0.82 to 0.06) TaggedAPTARAEnd 2TaggedAPTARAEnd 0%, p = 0.90TaggedAPTARAEnd 0.09TaggedAPTARAEnd Low TaggedAPTARAEndTaggedAPTARAEnd
y c,d,e,
LDL-cTaggedAPTARAEnd 39TaggedAPTARAEnd 40TaggedAPTARAEnd 0.73 (1.84 to 0.38) TaggedAPTARAEnd 2TaggedAPTARAEnd 81%, p < 0.01TaggedAPTARAEnd 0.20TaggedAPTARAEnd Very low TaggedAPTARAEndTaggedAPTARAEnd
d,e
HDL-cTaggedAPTARAEnd 90TaggedAPTARAEnd 92TaggedAPTARAEnd 0.34 (0.04 to 0.63)*TaggedAPTARAEnd 5TaggedAPTARAEnd 2%, p = 0.41TaggedAPTARAEnd 0.03TaggedAPTARAEnd Low TaggedAPTARAEndTaggedAPTARAEnd
d,e
TGTaggedAPTARAEnd 90TaggedAPTARAEnd 92TaggedAPTARAEnd 0.28 (0.63 to 0.08)TaggedAPTARAEnd 5TaggedAPTARAEnd 29%, p = 0.22TaggedAPTARAEnd 0.12TaggedAPTARAEnd Low TaggedAPTARAEndTaggedAPTARAEnd
,y d,e
GlucoseTaggedAPTARAEnd 47TaggedAPTARAEnd 47TaggedAPTARAEnd 1.19 (1.63 to 0.74)* TaggedAPTARAEnd 3TaggedAPTARAEnd 0%, p = 0.48TaggedAPTARAEnd <0.01TaggedAPTARAEnd Low TaggedAPTARAEndTaggedAPTARAEnd
d,e
CRPTaggedAPTARAEnd 83TaggedAPTARAEnd 82TaggedAPTARAEnd 1.00 (1.32 to 0.67)*TaggedAPTARAEnd 4TaggedAPTARAEnd 0%, p = 0.79TaggedAPTARAEnd <0.01TaggedAPTARAEnd Low TaggedAPTARAEndTaggedAPTARAEndTaggedAPTARAEnd
Note: Total volume = number of exercises £ number of sets per exercise £ number of reps per exercise £ number of exercise sessions per week £ weeks of inter-
vention (LVRT median value was 5760 arbitrary units).TaggedAPTARAEnd
a
Outcome analyzed with anthropometric, dual energy X-ray absorptiometry and bioelectrical impedance analysis (kg and %). When the study had kg and % data,
preference was given to data in kg.
b
Outcome analyzed with anthropometric (cm), dual energy X-ray absorptiometry (kg and %), and bioelectrical impedance (%) analysis.
c
Downgraded by 1 level due to unexplained heterogeneity (large heterogeneity).Total volume = number of exercises £ number of sets per exercise £ number of
reps per exercise £ number of exercise sessions per week £ weeks of intervention (HVRT median value was 7200 arbitrary units).
d
Downgraded by 1 level due to indirectness of evidence (only 3 studies directly compared LVRT with HVRT and/or surrogate outcomes).
e
Downgraded by 1 level due to imprecision of results (small sample size and large 95%CI).
* p < 0.05 favors RT compared to CG.
y
Without outlier studies.
Abbreviations: 95%CI = 95% confidence interval; CG = control group; CRP = C-reactive protein; GRADE = certainty of the evidence (Grading of Recommenda-
2
tions, Assessment, Development, and Evaluation); HDL-c = high-density lipoprotein cholesterol; HVRT = high-volume resistance training group; I = heteroge-
neity; k = number of studies; LDL-c = low-density lipoprotein cholesterol; SMD = standardized mean difference; TC = total cholesterol; TG = triglycerides.