
Page 195 - 卫星导航2021年第1-2合期
P. 195
Li et al. Satell Navig (2021) 2:1 Page 9 of 14
Table 3 Technical specifcations of iMAR IMU-FSAS Te mean values of the number of visible satellites for
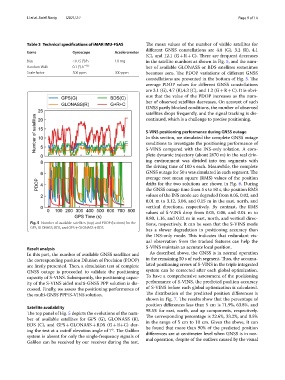
diferent GNSS constellations are 4.8 (G), 3.2 (R), 4.1
Items Gyroscope Accelerometer
(C), and 12.1 (G + R + C). Tere are frequent decreases
Bias <0.75 (°)/h 1.0 mg in the satellite numbers as shown in Fig. 5, and the num-
Random Walk 0.1 (°)·h −0.5 – ber of available GLONASS or BDS satellites sometimes
Scale factor 300 ppm 300 ppm becomes zero. Te PDOP variations of diferent GNSS
constellations are presented in the bottom of Fig. 5. Te
average PDOP values for diferent GNSS constellations
are 3.1 (G), 4.7 (R),4.3 (C), and 1.2 (G + R + C). It is obvi-
ous that the value of the PDOP increases as the num-
ber of observed satellites decreases. On account of such
GNSS partly blocked conditions, the number of observed
satellites drops frequently, and the signal tracking is dis-
continued, which is a challenge to precise positioning.
S‑VINS positioning performance during GNSS outage
In this section, we simulated the complete GNSS outage
conditions to investigate the positioning performance of
S-VINS compared with the INS-only solution. A com-
plete dynamic trajectory (about 2670 m) in the real driv-
ing environment was divided into ten segments with
the driving time of 100 s each. Meanwhile, the complete
GNSS outage for 50 s was simulated in each segment. Te
average root mean square (RMS) values of the position
drifts for the two solutions are shown in Fig. 6. During
the GNSS outage time from 5 s to 50 s, the position RMS
values of the INS mode are degraded from 0.05, 0.02, and
0.01 m to 3.12, 3.04, and 0.15 m in the east, north, and
vertical directions, respectively. By contrast, the RMS
values of S-VINS drop from 0.05, 0.06, and 0.01 m to
0.80, 1.16, and 0.12 m in east, north, and vertical direc-
Fig. 5 Number of available satellites (top) and PDOP (bottom) for the tions, respectively. It can be seen that the S-VINS mode
GPS, GLONASS, BDS, and GPS + GLONASS + BDS
has a slower degradation in positioning accuracy than
the INS-only mode. Tis indicates that redundant vis-
ual observation from the tracked features can help the
Result analysis S-VINS maintain an accurate local position.
In this part, the number of available GNSS satellites and As described above, the GNSS is in normal operation
the corresponding position Dilution of Precision (PDOP) in the remaining 50 s of each segment. Tus, the accumu-
are frstly presented. Ten, a simulation test of complete lated positioning errors of S-VINS in the triple integrated
GNSS outage is proceeded to validate the positioning system can be corrected after each global optimization.
capacity of S-VINS. Subsequently, the positioning capac- To have a comprehensive assessment of the positioning
ity of the S-VINS aided multi-GNSS PPP solution is dis- performance of S-VINS, the predicted position accuracy
cussed. Finally, we assess the positioning performance of of S-VINS before each global optimization is calculated.
the multi-GNSS PPP/S-VINS solution. Te distribution of the predicted position diferences is
shown in Fig. 7. Te results show that the percentage of
position diferences less than 5 cm is 71.9%, 63.8%, and
Satellite availability 98.5% for east, north, and up components, respectively.
Te top panel of Fig. 5 depicts the evolutions of the num- Te corresponding percentage is 22.6%, 33.2%, and 0.5%
ber of available satellites for GPS (G), GLONASS (R), in the range of 5 cm to 10 cm. Given the above, it can
BDS (C), and GPS + GLONASS + BDS (G + R+C) dur- be found that more than 90% of the predicted position
ing the test at a cutof elevation angle of 7 . Te Galileo diferences are at centimeter level when GNSS is in nor-
◦
system is absent for only the single-frequency signals of mal operation, despite of the outliers caused by the visual
Galileo can be received by our receiver during the test.