
Page 142 - 卫星导航2021年第1-2合期
P. 142
Liu et al. Satell Navig (2021) 2:6 Page 9 of 17
Static test 2.00, and 1.42, respectively. Tese results demonstrate
Te static data were also collected from the static experi- that the geometry strength was improved signifcantly by
ments performed in the Wuhan University campus (as combining BDS-3/BDS-2. Meanwhile, because enough
demonstrated in the “Data collection”), on June 21, 2020. BDS-3 satellites with good geometry were available, a rel-
A short baseline with a length of approximately 371 m atively superior RTK performance was expected for BDS-
was selected, whose endpoints were a Trimble Alloy #2 3. It is noteworthy that the frequent jumps in the number
receiver at a SGG station and a Javad TRE_3 receiver at of observed satellites and PDOP series for BDS-2 were
WUH2. Te BDS-2/BDS-3 satellites were observed with primarily caused by the intermittent tracking of C05.
sampling interval of 30 s and elevation cut-of angle of Figure 7 shows the average number of BDS-3/BDS-2
10°. satellites and their PDOP values during the entire obser-
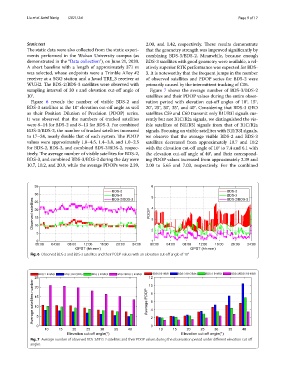
Figure 6 reveals the number of visible BDS-2 and vation period with elevation cut-of angles of 10°, 15°,
BDS-3 satellites at the 10° elevation cut-of angle as well 20°, 25°, 30°, 35°, and 40°. Considering that BDS-3 GEO
as their Position Dilution of Precision (PDOP) series. satellites C59 and C60 transmit only B1I/B3I signals cur-
It was observed that the numbers of tracked satellites rently but not B1C/B2a signals, we distinguished the vis-
were 8–14 for BDS-2 and 8–13 for BDS-3. For combined ible satellites of B1I/B3I signals from that of B1C/B2a
BDS-3/BDS-2, the number of tracked satellites increased signals. Focusing on visible satellites with B1I/B3I signals,
to 17–24, nearly double that of each system. Te PDOP we observe that the average visible BDS-2 and BDS-3
values were approximately 1.8–4.5, 1.4–3.8, and 1.0–2.5 satellites decreased from approximately 10.7 and 10.2
for BDS-2, BDS-3, and combined BDS-3/BDS-2, respec- with the elevation cut-of angle of 10° to 7.4 and 6.1 with
tively. Te average number of visible satellites for BDS-2, the elevation cut-of angle of 40°, and their correspond-
BDS-3, and combined BDS-3/BDS-2 during the day were ing PDOP values increased from approximately 2.39 and
10.7, 10.2, and 20.9, while the average PDOPs were 2.39, 2.00 to 5.65 and 7.03, respectively. For the combined
Fig. 6 Observed BDS-2 and BDS-3 satellites and their PODP values with an elevation cut-of angle of 10°
Fig. 7 Average number of observed BDS-3/BDS-2 satellites and their PDOP values during the observation period under diferent elevation cut-of
angles