
Page 145 - 卫星导航2021年第1-2合期
P. 145
Liu et al. Satell Navig (2021) 2:6 Page 12 of 17
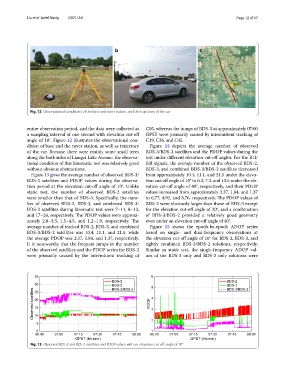
Fig. 12 Observational conditions of the base and rover station, and the trajectory of the car
entire observation period, and the data were collected at C05, whereas the jumps of BDS-3 at approximately 07:00
a sampling interval of one second with elevation cut-of GPST were primarily caused by intermittent tracking of
angle of 10°. Figure 12 illustrates the observational con- C19, C36, and C45.
dition of base and the rover station, as well as trajectory Figure 14 depicts the average number of observed
of the car. Because there were mainly some small trees BDS-3/BDS-2 satellites and the PDOP values during the
along the both sides of Liangzi Lake Avenue, the observa- test under diferent elevation cut-of angles. For the B1I/
tional condition of this kinematic test was relatively good B3I signals, the average number of the observed BDS-2,
without obvious obstructions. BDS-3, and combined BDS-3/BDS-2 satellites decreased
Figure 13 gives the average number of observed BDS-3/ from approximately 10.4, 11.1, and 21.5 under the eleva-
BDS-2 satellites and PDOP values during the observa- tion cut-of angle of 10° to 6.2, 7.3, and 13.5 under the ele-
tion period at the elevation cut-of angle of 10°. Unlike vation cut-of angle of 40°, respectively, and their PDOP
static test, the number of observed BDS-2 satellites values increased from approximately 2.37, 1.84, and 1.37
were smaller than that of BDS-3. Specifcally, the num- to 6.77, 4.92, and 3.76, respectively. Te PDOP values of
ber of observed BDS-2, BDS-3, and combined BDS-3/ BDS-2 were obviously larger than those of BDS-3 except
BDS-2 satellites during kinematic test were 7–11, 8–13, for the elevation cut-of angle of 20°, and a combination
and 17–24, respectively. Te PDOP values were approxi- of BDS-3/BDS-2 provided a relatively good geometry
mately 2.0–3.3, 1.5–4.5, and 1.2–1.9, respectively. Te even under an elevation cut-of angle of 40°.
average number of tracked BDS-2, BDS-3, and combined Figure 15 shows the epoch-by-epoch ADOP series
BDS-3/BDS-2 satellites was 10.4, 11.1, and 21.5, while based on single- and dual-frequency observations at
the average PDOP was 2.37, 1.84, and 1.37, respectively. the elevation cut-of angle of 10° for BDS-2, BDS-3, and
It is noteworthy that the frequent jumps in the number tightly combined BDS-3/BDS-2 solutions, respectively.
of the observed satellites and the PDOP series for BDS-2 Similar as static test, the single-frequency ADOP val-
were primarily caused by the intermittent tracking of ues of the BDS-3 only and BDS-2 only solutions were
Fig. 13 Observed BDS-2 and BDS-3 satellites and PODP values with an elevation cut-of angle of 10°