
Page 141 - 卫星导航2021年第1-2合期
P. 141
Liu et al. Satell Navig (2021) 2:6 Page 8 of 17
Performance assessment of tightly combined Evaluation statistics
BDS-2/BDS-3 RTK Te performance of BDS-3/BDS-2 RTK positioning was
In this part, we carry out performance evaluation of evaluated by ambiguity resolution success rate, Ambigu-
single-epoch short-baseline RTK positioning with cur- ity Dilution of Precision (ADOP), together with position-
rent BDS-2 and BDS-3 full constellations. Te tightly ing accuracy.
combined BDS-3/BDS-2 solution is then compared with ADOP is a well-known theoretical fgure of merit for
BDS-3 only and BDS-2 only solutions with observations inferring the average precision of estimated ambiguities
from two common signals (B1I and B3I). For the BDS-3 from foat solution, which is expressed as (Teunissen
only solutions, we also compared the RTK performance 1997):
of new B1C/B2a navigation signals with that of the legacy 1
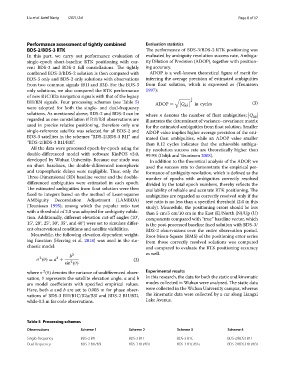
B1I/B3I signals. Four processing schemes (see Table 5) ADOP = n in cycles (3)
were adopted for both the single- and dual-frequency Q ˆ aˆ a
solutions. As mentioned above, BDS-2 and BDS-3 can be
where n denotes the number of foat ambiguities; Q ˆ aˆ a
regarded as one constellation if B1I/B3I observations are illustrates the determinant of variance–covariance matrix
used in precise relative positioning, therefore only one for the estimated ambiguities from foat solution. Smaller
single-reference satellite was selected for all BDS-2 and ADOP value implies higher average precision of the esti-
BDS-3 satellites in the schemes “BDS-2/BDS-3 B1I” and mated foat ambiguities, while an ADOP value smaller
“BDS-2/BDS-3 B1I/B3I”. than 0.12 cycles indicates that the achievable ambigu-
All the data were processed epoch-by-epoch using the ity resolution success rate are theoretically higher than
double-diferenced model with software KinPOS v3.0, 99.9% (Odijk and Teunissen 2008).
developed by Wuhan University. Because our study was In addition to the theoretical analysis of the ADOP, we
on short baselines, the double-diferenced ionospheric used the success rate to demonstrate the empirical per-
and tropospheric delays were negligible. Tus, only the formance of ambiguity resolution, which is defned as the
Tree-Dimensional (3D) baseline vector and the double- number of epochs with ambiguities correctly resolved
diferenced ambiguities were estimated in each epoch. divided by the total epoch numbers, thereby refects the
Te estimated ambiguities from foat solution were then availability of reliable and accurate RTK positioning. Te
fxed to integers based on the method of Least-squares ambiguities are regarded as correctly resolved only if the
AMBiguity Decorrelation Adjustment (LAMBDA) test ratio is no less than a specifed threshold (2.0 in this
(Teunissen 1995), among which the popular ratio test study). Meanwhile, the positioning errors should be less
with a threshold of 2.0 was adopted for ambiguity valida- than 5 cm/5 cm/10 cm in the East (E)/North (N)/Up (U)
tion. Additionally, diferent elevation cut-of angles (10°, components compared with “true” baseline vector, which
15°, 20°, 25°, 30°, 35°, and 40°) were set to simulate difer- is the post-processed baseline fxed solution with BDS-3/
ent observational conditions and satellite visibilities. BDS-2 observations over the entire observation period.
Meanwhile, the following elevation-dependent weight- Root-Mean-Square (RMS) of the positioning error series
ing function (Herring et al. 2018) was used in the sto- from those correctly resolved solutions was computed
chastic model: and compared to evaluate the RTK positioning accuracy
as well.
2
b
2
2
σ (θ) = a + 2 (2)
sin (θ)
2
where σ (θ) denotes the variance of undiferenced obser- Experimental results
vation, θ represents the satellite elevation angle. a and b In this research, the data for both the static and kinematic
are model coefcients with specifed empirical values. modes collected in Wuhan were analyzed. Te static data
Here, both a and b are set to 0.003 m for phase obser- were collected in the Wuhan University campus, whereas
vations of BDS-3 B1I/B1C/B2a/B3I and BDS-2 B1I/B3I, the kinematic data were collected by a car along Liangzi
while 0.3 m for code observations. Lake Avenue.
Table 5 Processing schemes
Observations Scheme 1 Scheme 2 Scheme 3 Scheme 4
Single-frequency BDS-2 B1I BDS-3 B1I BDS-3 B1C BDS-2/BDS3 B1I
Dual-frequency BDS-2 B1I/B3I BDS-3 B1I/B3I BDS-3 B1C/B2a BDS-2/BDS3 B1I/B3I