
Page 111 - 卫星导航2021年第1-2合期
P. 111
Shinghal and Bisnath Satell Navig (2021) 2:10 Page 14 of 17
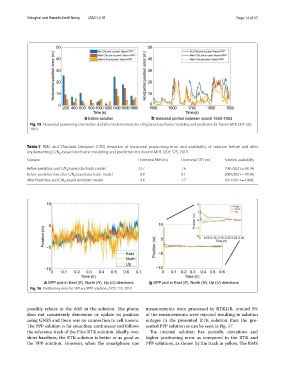
Fig. 15 Horizontal positioning error before and after implementing the C/N -based stochastic modeling and prediction for Xiaomi MI 8, DOY 325,
0
2019
Table 7 RMS and STandard Deviation (STD) deviation of horizontal positioning error and availability of solution before and after
implementing C/N -based stochastic modeling and prediction for Xiaomi MI 8, DOY 325, 2019
0
Scenario Horizontal RMS (m) Horizontal STD (m) Solution availability
-based stochastic model 12.7 7.6 1995/2021 = 98.7%
Before prediction and C/N 0
Before prediction but after C/N -based stochastic model 8.0 5.1 2004/2021 = 99.2%
0
-based stochastic model 4.6 2.7 2021/2021 = 100%
After Prediction and C/N 0
Fig. 16 Positioning error for SPP and PPP solutions, DOY 225, 2019
possibly relates to the drift in the solution. Te phone measurements were processed in RTKLIB, around 8%
does not consistently determine or update its position of the measurements were rejected resulting in solution
using GNSS and there was no connection to cell towers. outages in the presented RTK solution than the pre-
Te PPP solution is far smoother, continuous and follows sented PPP solution as can be seen in Fig. 17.
the reference track of the Piksi RTK solution. Ideally, over Te internal solution has periodic deviations and
short baselines, the RTK solution is better or as good as higher positioning error as compared to the RTK and
the PPP solution. However, when the smartphone raw PPP solutions, as shown by the track in yellow. Te RMS