
Page 108 - 卫星导航2021年第1-2合期
P. 108
Shinghal and Bisnath Satell Navig (2021) 2:10 Page 11 of 17
Fig. 12 Change in carrier-phase measurements compared to Doppler measurements for a kinematic dataset in a medium multipath environment,
DOY 325, 2019
measurements are not continuous, with more frequent n�XY − �X�Y
and larger gaps than for the carrier-phase data gaps. m = n�X − (�X) 2 (2)
2
Te occurrence of long durations of missing Doppler
measurements can be attributed to poor carrier-phase
tracking in challenging environments and due to the c = Y − mX (3)
low-cost antenna. n
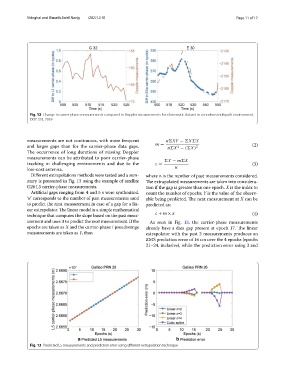
Diferent extrapolations methods were tested and a sum- where n is the number of past measurements considered.
mary is presented in Fig. 13 using the example of satellite Te extrapolated measurements are taken into considera-
G26 L5 carrier-phase measurements. tion if the gap is greater than one epoch. X is the index to
Artifcial gaps ranging from 4 and 5 s were synthesized. count the number of epochs; Y is the value of the observ-
‘n’ corresponds to the number of past measurements used able being predicted. Te next measurement at X can be
to predict the next measurement in case of a gap for a lin- predicted as:
ear extrapolator. Te linear model is a simple mathematical
technique that computes the slope based on the past meas- c + m × x (4)
urement and uses it to predict the next measurement. If the As seen in Fig. 13, the carrier-phase measurements
epochs are taken as X and the carrier-phase / pseudorange already have a data gap present at epoch 17. Te linear
measurements are taken as Y, then extrapolator with the past 2 measurements produces an
RMS prediction error of 16 cm over the 4 epochs (epochs
21–24, inclusive), while the prediction error using 3 and
Fig. 13 Predicted L5 measurements and prediction error using diferent extrapolation technique