
Page 156 - 《水产学报》2026年第04期
P. 156
4 期 陈 治,等:基于 eDNA 宏条形码与拖网调查的鱼类多样性结果比较——以浙江南部海域为例 50 卷
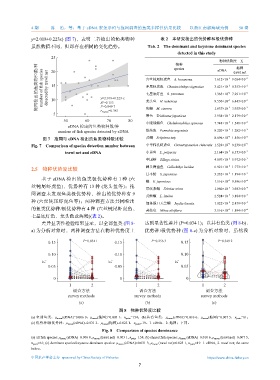
y=2.018+0.223x) (图 7),表明二者检出的鱼类物种 表 2 本研究检出的优势种和极优势种
虽然数值不同,但却存在相同的变化趋势。 Tab. 2 The dominant and keystone dominant species
detected in this study
25
物种优势度 Y i
物种
拖网检出的鱼类物种数/种 number of fish species detected by trawl net 15 y=2.018+0.223·x 六丝钝尾虾虎鱼 A. hexanema 1.612×10 −1 −3 −2 −2 9.054×10 −2 −2 −2 −2
拖网
species
eDNA
20
trawl net
8.353×10
矛尾虾虎鱼 Chaeturichthys stigmatias
3.421×10
七星底灯鱼 B. pterotum
1.363×10
7.291×10
10
2
P=0.049 7
3.935×10
1.637×10
海鳗 M. cinereu
r Pearson =0.381
5 R =0.153 龙头鱼 H. nehereus 9.550×10 −2 6.443×10 −2
带鱼 Trichiurus japonicus 3.958×10 −3 2.179×10 −2
50 60 70 80
小眼绿鳍鱼 Chelidonichthys spinosus 7.748×10 −3 1.548×10 −2
eDNA 检出的鱼类物种数/种
number of fish species detected by eDNA 银姑鱼 Pennahia argentata 8.220×10 −3 1.282×10 −2
图 7 拖网与 eDNA 检出的鱼类物种数比较 黄鲫 Setipinna taty 8.696×10 −3 1.156×10 −2
Fig. 7 Comparison of species detection number between 中华栉孔虾虎鱼 Ctenotrypauchen chinensis 1.528×10 −2 9.239×10 −3
trawl net and eDNA 小黄鱼 L. polyactis 2.164×10 −2 6.353×10 −3
中国鱚 Sillago sinica 4.097×10 −2 5.972×10 −3
2.5 物种优势度比较 棘头梅童鱼 Collichthys lucidus 6.921×10 −2 1.773×10 −3
日本鲭 S. japonicus 3.232×10 −2 1.194×10 −3
基于 eDNA 检出的鱼类极优势种有 1 种 (六
鳀 E. japonicus 1.516×10 −2 9.596×10 −4
丝钝尾虾虎鱼)、优势种有 13 种 (龙头鱼等);拖
带纹条鳎 Zebrias zebra 1.060×10 −2 3.983×10 −4
网调查未发现鱼类极优势种,检出的优势种有 9
黄鮟鱇 L. litulon 2.524×10 −2 3.184×10 −4
种 (六丝钝尾虾虎鱼等);两种调查方法共同检出
细条银口天竺鲷 Jaydia lineata 1.022×10 −2 2.879×10 −4
的鱼类优势种/极优势种有 4 种 (六丝钝尾虾虎鱼、 黄姑鱼 Nibea albiflora 3.516×10 −2 1.194×10 −4
七星底灯鱼、龙头鱼及海鳗)(表 2)。
差异显著性检验结果显示,以全部鱼类 (图 8- 达到显著性差异 (P=0.034 1);以共有鱼类 (图 8-b)、
a) 为分析对象时,两种调查方法在物种优势度上 优势种/极优势种 (图 8-c) 为分析对象时,虽然没
P=0.034 1 P=0.256 3 P=0.349 2
0.15 0.15 0.15
0.10 0.10 0.10
Y i Y i Y i
0.05 0.05 0.05
0 0 0
1 2 1 2 1 2
调查方法 调查方法 调查方法
survey methods survey methods survey methods
(a) (b) (c)
图 8 物种优势度比较
(a) 全部鱼类:μ mean (eDNA)=0.006 0,μ mean (拖网)=0.003 1,n pairs =154;(b) 共有鱼类:μ mean (eDNA)=0.010 6,μ mean (拖网)=0.007 5,n pairs =61;
(c) 优势种/极优势种:μ mean (eDNA)=0.031 3,μ mean (拖网)=0.023 1,n pairs =19。1. eDNA,2. 拖网;下同。
Fig. 8 Comparison of species dominance
(a) all fish species: μ mean (eDNA)=0.006 0, μ mean (trawl net)=0.003 1, n pairs =154; (b) shared fish species: μ mean (eDNA)=0.010 6, μ mean (trawl net)=0.007 5,
n pairs =61; (c) dominant species/keystone dominant species: μ mean (eDNA)=0.031 3, μ mean (trawl net)=0.023 1, n pairs =19. 1. eDNA, 2. trawl net; the same
below.
中国水产学会主办 sponsored by China Society of Fisheries https://www.china-fishery.cn
7