Page 229 - 《水产学报》2026年第2期
P. 229

2 期                                     水    产    学    报                                 50 卷


                         40                                        40
                                           y=−3.510x+39.38
                         35                                        35                y=−3.584x+38.93
                                           R =0.999 3                                R =0.999 3
                                            2
                                                                                      2
                         30                                        30
                      C t 值  C t  value  25                     C t 值  C t  value  25
                                                                   20
                         20
                         15                                        15
                         10                                        10
                          5                                         5
                             1  2   3  4   5  6   7  8   9             1  2   3  4   5  6   7  8  9
                                      模板浓度对数                                    模板浓度对数
                                 log of template concentration             log of template concentration
                                          (a)                                       (b)
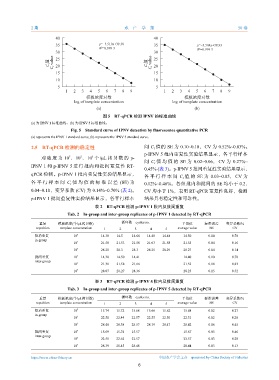
                                             图 5    RT-qPCR  检测  IPNV  的标准曲线
              (a) 为  IPNV 1  标准曲线,(b) 为  IPNV 5  标准曲线。
                               Fig. 5 Standard curve of IPNV detection by fluorescence quantitative PCR
              (a) represents the IPNV 1 standard curve, (b) represents the IPNV 5 standard curve.
                                                                   t
               2.5    RT-qPCR  检测的稳定性                          间  C 值的  SE  为  0.10~0.18,CV  为  0.52%~0.83%。
                                                               p-IPNV 5  批内重复性实验结果显示,各平行样本
                                        3
                              7
                                   5
                   对 浓 度 为  10 、 10 、 10 个 /μL  拷 贝 数 的  p-
                                                               间  C 值 均 值 的   SE  为  0.02~0.06, CV  为  0.27%~
                                                                   t
              IPNV 1  和  p-IPNV 5  进行批内和批间重复性          RT-
                                                               0.45% (表  3)。p-IPNV 5  批间重复性实验结果显示,
              qPCR  检测。p-IPNV 1   批内重复性实验结果显示,                 各 平 行 样 本 间    C 值 的  SE  为  0.03~0.05, CV  为
                                                                               t
              各 平 行 样 本 间     C 值 均 值 的 标 准 误 差     (SE) 为     0.12%~0.46%。各组批内和批间的           SE  均小于  0.2,
                               t
              0.04~0.10,变异系数     (CV) 为  0.14%~0.70% (表  2)。   CV  均小于   1%,表明    RT-qPCR  重复性良好,检测
              p-IPNV 1  批间重复性实验结果显示,各平行样本                      结果具有稳定性和可靠性。

                                          表 2    RT-qPCR  检测  p-IPNV 1  批内及批间重复
                              Tab. 2    In-group and inter-group replicates of p-IPNV 1 detected by RT-qPCR
                  重复      模板浓度(个/μL拷贝数)              循环数 cycles no.            平均值      标准误差     变异系数/%
                repetition  template concentration  1  2   3     4      5    average value  SE      CV
                批内重复            10 7        14.38  14.5  14.66  14.48  14.48   14.50      0.10      0.70
                in-group
                                10 5        21.58  21.53  21.58  21.63  21.58  21.58      0.04      0.16
                                10 3        28.21  28.3  28.3   28.25  28.29   28.27      0.04      0.14
                批间重复            10 7        14.30  14.50  14.41                14.40      0.10      0.70
                inter-group
                                10 5        21.31  21.58  21.66                21.52      0.18      0.83
                                10 3        28.07  28.27  28.36                28.23      0.15      0.52

                                          表 3    RT-qPCR  检测  p-IPNV 5  批内及批间重复
                              Tab. 3    In-group and inter-group replicates of p-IPNV 5 detected by RT-qPCR

                  重复      模板浓度(个/μL拷贝数)              循环数 cycles no.            平均值      标准误差     变异系数/%
                repetition  template concentration  1  2   3     4      5    average value  SE      CV
                批内重复            10 7        15.74  15.72  15.68  15.66  15.62  15.68      0.02      0.27
                in-group
                                10 5        22.51  22.44  22.57  22.55  22.50  22.51      0.02      0.20
                                10 3        28.48  28.38  28.57  28.19  28.47  28.42      0.06      0.45
                批间重复            10 7        15.69  15.74  15.57                15.67      0.05      0.46
                inter-group
                                10 5        22.51  22.62  22.57                22.57      0.03      0.20
                                10 3        28.39  28.45  28.48                28.44      0.03      0.13

              https://www.china-fishery.cn                           中国水产学会主办    sponsored by China Society of Fisheries
                                                            6
   224   225   226   227   228   229   230   231   232   233   234