
Page 212 - 《水产学报》2025年第11期
P. 212
葛辉,等 水产学报, 2025, 49(11): 119417
3 000 20
阳性 positive 15 T
阴性 negative
荧光强度/RFU fluorescence intensity 2 000 10 相对荧光强度 relative fluorescence C
1 000
0 5 0
0.5 1.0 2.0 5.0 10.0 10 20 30 80 100
报告探针浓度/(μmol/L) 报告探针浓度/(nmol/L)
concentration of reporter concentration of reporter
(a) (b)
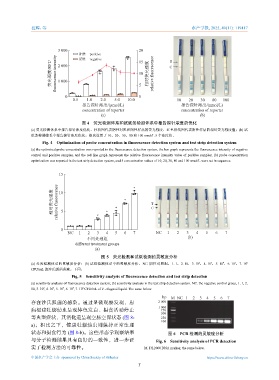
图 4 荧光检测体系和试纸条检测体系中报告探针浓度的优化
(a) 荧光检测体系中报告探针浓度优化,柱状图代表阴性对照和阳性样品的荧光强度,红色折线图代表阳性样品的相对荧光强度值;(b) 试
纸条检测体系中报告探针浓度优化,依次设置了 10、20、30、80 和 100 nmol/L 5 个浓度值。
Fig. 4 Optimization of probe concentration in fluorescence detection system and test strip detection system
(a) the optimized probe concentration was reported in the fluorescence detection system, the bar graph represents the fluorescence intensity of negative
control and positive samples, and the red line graph represents the relative fluorescence intensity value of positive samples; (b) probe concentration
optimization was reported in the test strip detection system, and 5 concentration values of 10, 20, 30, 80 and 100 nmol/L were set in sequence.
15
相对荧光强度 relative fluorescence 10 * * * * * T C
5
0
NC 1 2 3 4 5 6 7 NC 1 2 3 4 5 6 7
不同处理组 (b)
different treatment groups
(a)
图 5 荧光检测和试纸检测的灵敏度分析
4
5
2
3
(a) 荧光检测体系的灵敏度分析;(b) 试纸检测体系中的灵敏度分析。NC. 阴性对照组,1. 1,2. 10,3. 10 ,4. 10 ,5. 10 ,6. 10 ,7. 10 6
CFU/mL 的沙氏弧菌菌液。下同。
Fig. 5 Sensitivity analysis of fluorescence detection and test strip detection
(a) sensitivity analysis of fluorescence detection system; (b) sensitivity analysis in the test strip detection system. NC. the negative control group, 1. 1, 2.
6
2
3
5
4
10, 3. 10 , 4. 10 , 5. 10 , 6. 10 , 7. 10 CFU/mL of V. chagasii liquid. The same below.
bp M NC 1 2 3 4 5 6 7
存在沙氏弧菌的感染。通过显微观察发现,患 2 000
1 000
病福建牡蛎幼虫呈现体色发白、摄食活动停止 750
500
等典型症状,其消化道呈现空肠空胃状态 (图 8- 250
100
a);相比之下,健康牡蛎幼虫则保持正常生理
状态和摄食行为 (图 8-b)。这些形态学观察结果 图 6 PCR 检测的灵敏度分析
与分子检测结果具有良好的一致性,进一步证 Fig. 6 Sensitivity analysis of PCR detection
实了检测方法的可靠性。 M. DL2000 DNA marker, the same below.
中国水产学会主办 sponsored by China Society of Fisheries https://www.china-fishery.cn
7