
Page 48 - 《爆炸与冲击》2025年第9期
P. 48
第 45 卷 王 振,等: 平整壁面通道内冲击波传播试验研究 第 9 期
波面的超压上升是冲击波在地面上马赫杆的形成所致。在口内 11 m 处,更多的峰值出现在第 1 个正超
压段内。在口内 15 m 处,第 1 个正超压段的轮廓形状开始接近于三角形。在口内 19 m 处,超压时程曲
线上第 1 峰值后再次出现紧随的超压峰值波动。在口内 23 m 处,第 1 峰值几乎没有衰减,超压时程曲线
第 1 个正超压段的三角形轮廓特征突然消失。在口内 27 m 处,冲击波到达该测点后经过长度 3 m 的通
道段将进入开放空间,超压时程曲线的轮廓整体恢复为三角形。
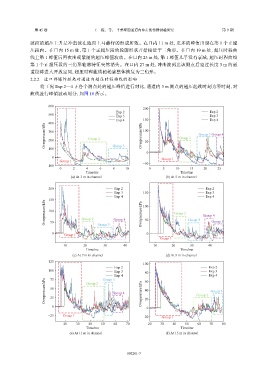
2.2.2 近口部爆炸距离对通道内超压时程曲线的影响
将工况 Exp 2~4 下各个测点处的超压峰值进行对比,通道内 3 m 测点的超压起跳时刻为零时刻,对
曲线进行峰值波动划分,如图 10 所示。
600
200
Exp 2 Exp 2
500 Exp 3 Exp 3
Exp 4 150 Exp 4
400
Overpressure/kPa 300 Group 2 Overpressure/kPa 100 Group 2 Group 3 Group 4
200
50
Group 3
100
0
0 Group 1
Group 1 −50
−100
0 2 4 6 8 10 0 5 10 15 20 25
Time/ms Time/ms
(a) At 3 m in channel (b) At 5 m in channel
200 Exp 2 Exp 2
Exp 3 150 Exp 3
Exp 4 Exp 4
150 100
Overpressure/kPa 100 Group 2 Group 4 Overpressure/kPa 50 Group 2 Group 3 Group 4
Group 5
50
0 Group 3 0
Group 1
Group 1
10 20 30 40 10 20 30 40
Time/ms Time/ms
(c) At 7 m in channel (d) At 9 m in channel
125
100
Exp 2 Exp 2
100 Exp 3 80 Exp 3
Exp 4 60 Exp 4
75
Group 3
Overpressure/kPa 50 Group 2 Group 4 Overpressure/kPa 40 Group 2 Group 3
25
0 20 0
−25 Group 1 −20 Group 1
20 30 40 50 60 70 20 30 40 50 60 70 80
Time/ms Time/ms
(e) At 11 m in channel (f) At 15 m in channel
092201-7
−20
−20