Page 71 - 《中国药科大学学报》2026年第1期
P. 71

第  57 卷第  1 期      王俪颖,等:Isthmin-1 通过调控   FoxO  信号通路抑制非小细胞肺癌细胞生长的研究                         65
                A                   KEGG enrichment ScatterPlot  B                      GO_term: molecular function

                          hsa04110 | Cell cycle                            GO:0005515 | protein binding
               hsa05168 | Herpes simplex virus 1 infection                GO:0046872 | metal ion binding
                                                  Gene number                                         Gene number
                 hsa03013 | Nucleocytoplasmic transport  50             GO:0008017 | microtubule binding  200
                                                                                                         400
                                                    100
                      hsa04140 | Autophagy-animal   150        GO:0000981 | DNA-binding transcription factor activity  600
                      hsa05210 | Colorectal cancer  200                  GO:0016740 | transferase activity  800
                  hsa05220 | Chronic myeloid leukemia  P value  GO:0000978 | RNA polymerase Il cis-regulatory region  P value
                       hsa05215 | Prostate cancer  1e−06      GO:0000976 | transcription cis-regulatory region binding  2.5e−08
                    hsa04115 | p53 signaling pathway  2e−06              GO:0000166 | nucleotide binding  5.0e−08
                                                                                                        7.5e−08
                hsa04120 | Ubiquitin mediated proteolysis      GO:0003700 | DNA-binding transcription factor activity
                   hsa04068 | FoxOsignaling pathway        GO:1990837 | sequence-specific double-stranded DNA binding
                                        0.4  0.5                                         0.050 0.075  0.100  0.125 0.150
                                        Rich factor                                          Rich factor
                C                                GO_term: biological process  D         GO_term: cellular component

                           GO:0006695 | cholesterol biosynthetic process     GO:0005737 | cytoplasm
                              GO:0016126 | sterol biosynthetic process  Gene number  GO:0005829 | cytosol  Gene number
                                                                  20
                GO:0000122 | negative regulation of transcription by RNA polymerase II  40  GO:0005856 | cytoskeleton  100
                                                                  60                                     200
                             GO:0007399 | nervous system development          GO:0005634 | nucleus       300
                                                                  80
                GO:0045944 | positive regulation of transcription by RNA polymerase II  GO:0000785 | chromatin 1  400
                                                                  100
                                      GO:0007049 | cell cycle             GO:0030139 | endocytic vesicle  P value
                                                                P value
                            GO:0008203 | cholesterol metabolic process   GO:0005886 | plasma membrane   2e−06
                                                                 2e−09
                             GO:0006694 | steroid biosynthetic process  4e−09  GO:0042995 | cell projection  4e−06
                                     GO:0051301 | cell division  6e−09   GO:0070161 | anchoring junction  6e−06
                                                                 8e−09
                              GO:0008202 | steroid metabolic process      GO:0005794 | Golgi apparatus
                                                    0.1 0.2 0.3 0.4 0.5                   0.05 0.10 0.15 0.20
                                                      Rich factor                            Rich factor
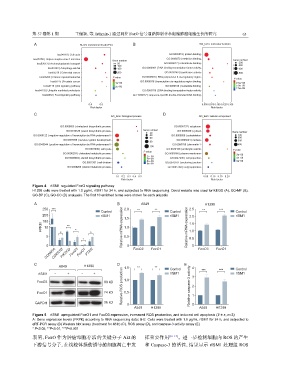
               Figure 4    rISM1 regulated FoxO signaling pathway
               H1299 cells were treated with 1.0 μg/mL rISM1 for 24 h, and subjected to RNA sequencing. David website was used for KEGG (A), GO-MF (B),
               GO-BP (C), GO-CC (D) analyasis. The first 10 enriched terms were shown for each anlyasis
                A                                   B          A549                       H1299

                    250 ***                            2.0   **     **             2.5   **     ***
                                             Control                       Control                      Control
                    200                      rISM1     1.5                 rISM1   2.0                  rISM1
                   FPKM 150   **  *                   Relative mRNA expression  1.0  Relative mRNA expression  1.5
                    10
                                                                                   1.0
                     5     *            *              0.5
                                     *                                             0.5
                     0                                  0  FoxO3   FoxO1             0  FoxO3  FoxO1
                     CDKN1A CDKN1B PIK3CD  FoxO3  FoxO1  PTEN


                C          A549       H1299         D  1.5   **     **           E   4
                                                      Relative ROS production       Relative caspase-3 activity  2
                                                                                                        rISM1
                                                                           rISM1
                  rISM1  −    +            −  +                            Control   3   ***    ***     Control
                 FoxO3                        90 kD    1.0
                 FoxO1                        74 kD    0.5                           1

                GAPDH                         36 kD     0                            0
                                                           A549    H1299                A549   H1299
               Figure 5    rISM1 upregulated FoxO1 and FoxO3 expression, increased ROS production, and induced cell apoptosis ( x ± s,n=3)
               A: Gene expression levels (FRPK) according to RNA sequencing data; B-E: Cells were treated with 1.0 μg/mL rISM1 for 24 h, and subjected to
               qRT-PCR assay (B) Western blot assay (treatment for 48 h) (C), ROS assay (D), and caspase-3 activity assay (E)
               * P<0.05, **P<0.01, ***P<0.001
               表明,FoxO    作为肿瘤细胞存活的关键分子                Akt 的    挥重要作用      [16−17] 。进一步检测细胞内      ROS  的产生
               下游信号分子,在线粒体损伤诱导的细胞凋亡中发                           和  Caspase-3 的活性,结果显示       rISM1 处理组    ROS
   66   67   68   69   70   71   72   73   74   75   76