Page 10 - 《振动工程学报》2025年第9期
P. 10

位移
                     −0.0
                                     时间
                                   缓冲器行程均值
                     位移
                                     时间
                                   缓冲器行程标准差
                       载荷
                       −1
                                     时间
                                                                                       缓冲器行程
                                   垂向轮胎力均值
                                                                         −50
                       载荷
                                                                         −100
                                                                         −150          位移
                                                                                       位移
                                     时间                                        对数坐标下       缓冲器行程
                1940                               振     动     工     程     学     报                     第 38 卷
                                   垂向轮胎力标准差

                          ×10 5                                             ×10 −5
                        8                                                2.5
                        7
                        6                                                2.0
                       载荷 / N 5 4 3                                     PDF  1.5
                        2                                                1.0
                        1                                                0.5
                        0
                       −1                                                 0
                         0      0.5    1.0    1.5    2.0                  6.5  7.0  7.5  8.0  8.5  9.0  9.5  10.0
                                     时间 / s                                            载荷 / N         ×10 5
                                 (e) 支柱轴向力均值
                                                                                 (c) 0.061 s垂向轮胎力PDF
                              (e) Mean of axial force on struts
                                                                             (c) PDF of vertical tire force at 0.061 s
                          ×10 4
                       2.0                                               10 0
                       1.8
                       1.6                                               −50
                       1.4                                              10
                      载荷 / N  1.0                                      PDF  10 −100
                       1.2
                       0.8
                       0.6
                                                                       10 −150
                       0.4
                       0.2
                        0                                                 6.5  7.0  7.5  8.0  8.5  9.0  9.5  10.0
                         0      0.5    1.0    1.5    2.0
                                                                                       载荷 / N         ×10 5
                                     时间 / s
                                (f) 支柱轴向力标准差                                 (d) 对数坐标下0.061 s垂向轮胎力PDF
                         (f) Standard deviation of axial force on struts    (d) PDF of vertical tire force in logarithmic
                                                                              coordinates at 0.061 s

                  图 3 DPIM  与  MCS  下的输出响应均值与标准差                            ×10 −5
                                                                         2.5
              Fig. 3 Mean and standard deviation of output responses under
                    DPIM and MCS                                         2.0
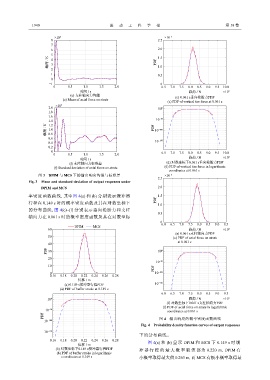
              率密度函数曲线,其中图            4(a) 和  (b) 分别表示缓冲器                 1.5
              行程在    0.149 s 时的概率密度函数及其在对数坐标下                           PDF  1.0
              的分布曲线,图       4(c)~(f) 分别表示垂向轮胎力和支柱
                                                                         0.5
              轴向力在     0.061 s 时的概率密度函数及其在对数坐标
                                                                          0
                                                                          6.0  6.5  7.0  7.5  8.0  8.5  9.0  9.5
                                   DPIM    MCS
                       60                                                              载荷 / N         ×10 5
                                                                                 (e) 0.061 s支柱轴向力PDF
                       50                                                      (e) PDF of axial force on struts
                                                                                  at 0.061 s
                       40
                      PDF  30                                            10 0
                       20
                                                                        10 −50
                       10
                                                                       PDF
                        0                                              10 −100
                        0.16  0.18  0.20  0.22  0.24  0.26  0.28
                                    位移 / m
                              (a) 0.149 s缓冲器行程PDF                      10 −150
                            (a) PDF of buffer stroke at 0.149 s
                                                                          6.0  6.5  7.0  7.5  8.0  8.5  9.0  9.5
                       10 0                                                            载荷 / N         ×10 5
                                                                             (f) 对数坐标下0.061 s支柱轴向力PDF
                                                                           (f) PDF of axial force on struts in logarithmic
                      10 −50                                                 coordinates at 0.061 s
                     PDF
                     10 −100                                             图 4 输出响应的概率密度函数曲线
                                                                 Fig. 4 Probability density function curves of output responses
                     10 −150
                                                                下的分布曲线。
                        0.16  0.18  0.20  0.22  0.24  0.26  0.28    图  4(a) 和  (b) 显 示  DPIM  和  MCS  下  0.149 s 时 缓
                                    位移 / m
                          (b) 对数坐标下0.149 s缓冲器行程PDF              冲 器 行 程 的 最 大 概 率 取 值 都为       0.220 m, DPIM  有
                           (b) PDF of buffer stroke in logarithmic
                             coordinates at 0.149 s             小概率取得最大值        0.263 m,而  MCS  有极小概率取得最

                            −5


                                    载荷
                                     垂向轮胎力


                       −50

                       −100

                       −150


                                    载荷
                             对数坐标下       垂向轮胎力


                            −5


                                    载荷
                                     支柱轴向力


                       −50

                       −100

                       −150


                                    载荷
                            对数坐标下        支柱轴向力
   5   6   7   8   9   10   11   12   13   14   15