Page 8 - 《渔业研究》2026年第3期
P. 8

金笑延等: 基于转录组学和代谢组学分析选育系                F 5 代与非选育系马苏大麻哈鱼卵基因表达及
                第 3 期                                 代谢物水平的差异                                         301

              分为   7  个大类,包括      36  个子类,主要为脂代谢               化系统(6.54%)以及其他次生代谢的生物合成
              (14.88%) ,其次是氨基酸代谢(11.31%) 、消                    (6.54%)等(图     5) 。


                     作用于 NAD(P)H 的氧化还原酶活性 Oxidoreductase activity, acting on NAD(P)H
                                         电压门控通道活性 Voltage-gated channel activity
                                    电压门控离子通道活性 Voltage-gated ion channel activity          校正后的 P 值
                                                         RNA 结合 RNA binding                P adj
                                  钙依赖性磷脂结合 Calcium-dependent phospholipid binding             1.00
                                                   外肽酶活性 Exopeptidase activity                0.75
                                                      铁离子结合 Iron ion binding
                                        核糖体结构成分 Structural constituent of ribosome            0.50
                                                    三价铁结合 Ferric iron binding                 0.25
                                              结构分子活性 Structural molecule activity             0
                                            氧化还原酶复合物 Oxidoreductase complex
                                            泛素连接酶复合物 Ubiquitin ligase complex
                                  组蛋白乙酰转移酶复合物 Histone acetyltransferase complex            数量 Count
                      质子转运双亚基 ATP 酶复合物 Proton-transporting two-sector ATPase complex         30
                                                   胶原蛋白三聚体 Collagen trimer                   60
                                           乙酰转移酶复合物 Acetyltransferase complex                90
                                    蛋白乙酰转移酶复合物 Protein acetyltransferase complex
                            cullin-RING 泛素连接酶复合物 Cullin-RING ubiquitin ligase complex
                                           核糖核蛋白复合物 Ribonucleoprotein complex
                                                             核糖体 Ribosome
                                                肽代谢过程 Peptide metabolic process
                                                   铁离子稳态 Iron ion homeostasis
                                细胞过渡金属离子稳态 Cellular transition metal ion homeostasis
                                           细胞铁离子稳态 Cellular iron ion homeostasis
                                            细胞化学稳态 Cellular chemical homeostasis
                                            细胞阳离子稳态 Cellular cation homeostasis
                                         细胞金属离子稳态 Cellular metal ion homeostasis
                                               细胞离子稳态 Cellular ion homeostasis
                                          多肽生物合成工艺 Peptide biosynthetic process
                                                             翻译 Translation
                                                                        0     0.02   0.04   0.06
                                                                             基因比率 Gene ratio
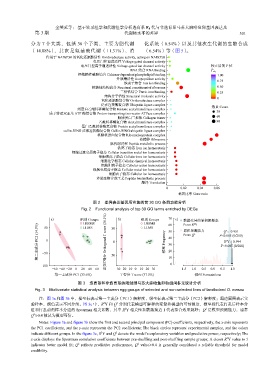
                                         图 2    差异表达基因所富集的前      30 GO  条目功能分析
                                    Fig. 2    Functional analysis of top 30 GO terms enriched by DEGs


                       a)          组别 Groups       b)        组别 Groups   70 c)  数据变异的累积解释率
                                    LBSMS        50           LBSMS      60    Perm R Y         Q :0.951
                                                                                    2
                 第二主成分 PC2 (14.5%)  −50 0     正交T得分 Orthogonal T score (26.1%)  0  频率 Frequency  40  Perm Q 2  P<0.005 (0/200)
                    50
                                                              LLMS
                                    LLMS
                                                                               累积预测能力
                                                                         50
                                                                                                  2
                                                                                                 R Y:0.994
                                                                                                 2
                                                                         30
                                                                                               P<0.005 (0/200)
                                                                         20
                  −100                          −50                      10 0
                       −60 −40 −20 0  20  40  60  −30−20−10 0 10 20 30        −1.5  −1.0  −0.5  0.0  0.5  1.0
                        第一主成分 PC1 (33.6%)           T 得分 T score (37.5%)            排列 Permutations
                                  图 3    选育系和非选育系的陆封型马苏大麻哈鱼卵粒组间多元统计分析
                Fig. 3    Multivariate statistical analysis between egg groups of selected and non-selected lines of landlocked O. masou
                  注:图  3a 和图  3b  中,横坐标表示第一主成分(PC1)解释度,纵坐标表示第二主成分(PC2)解释度;黑边圆圈表示实
                                                   2
              验样本,颜色表示不同分组。图           3c 中,R Y 2  和  Q 分别代表模型可解释的变量和模型的可预测度,横坐标代表打乱后样本分
              组和打乱前的样本分组的         Spearman  相关系数,其中  R Y 2  相关性系数越接近   1  代表拟合效果越好;Q 是模型预测能力,通常
                                                                                         2
               2
              Q ≥0.4  被认为模型可信。
                  Notes: Figure 3a and figure 3b show the first and second principal component (PC) coefficients, respectively, the x-axis represents
              the PC1 coefficients, and the y-axis represents the PC2 coefficients; The black circles represent experimental samples, and the colors
                                                  2
                                            2
              indicate different groups. In the figure 3c, R Y and Q  denote the model’s explanatory variables and predictive power, respectively; The
                                                                                                  2
              x-axis displays the Spearman correlation coefficients between pre-shuffling and post-shuffling sample groups; A closer R Y value to 1
                                  2
                                                            2
              indicates  better  model  fit;  Q   reflects  predictive  performance,  Q   value≥0.4  is  generally  considered  a  reliable  threshold  for  model
              credibility.
   3   4   5   6   7   8   9   10   11   12   13