
Page 83 - 《渔业研究》2025年第3期
P. 83
340 渔 业 研 究 第 47 卷
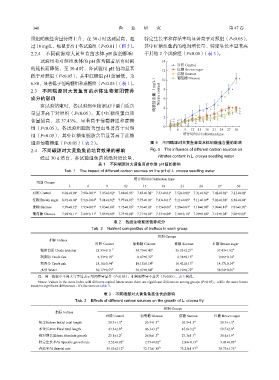
照组硝酸盐含量持续上升,在 30 d 时达到最高,超 特定生长率和存活率均显著高于对照组(P<0.05) ,
过 10 mg/L,极显著高于各试验组(P<0.01)(图 5)。 其中红糖组鱼苗的绝对增长量、特定生长率显著高
2.2.4 不同碳源对大黄鱼育苗水体 pH 值的影响 于其他 2 个试验组(P<0.05) (表 3) 。
试验组和对照组水体的 pH 值均随着培育时间 14
对照 Control
的延长而降低,至 30 d 时,各试验组 pH 值均显著 红糖 Brown sugar
12
低于对照组(P<0.05) ,其中红糖组 pH 值最低,为 蔗糖 Sucrose a
葡萄糖 Glucose
6.88,显著低于葡萄糖组和蔗糖组(P<0.05)(表 1)。 10
2.3 不同碳源对大黄鱼育苗水体生物絮团营养 硝酸盐含量/(mg/L) Nitrate content 8 a
成分的影响 6 a
在试验结束时,各试验组生物絮团中蛋白质含 4 a a b b
量显著高于对照组(P<0.05) ,其中红糖组蛋白质 a b b c c b b
2 a b b c c c
含量最高,达 37.43%,显著高于葡萄糖组和蔗糖 a a a a a b b b b b c c c
a a a b b
组(P<0.05) 。各试验组脂肪含量也显著高于对照 0 3 a 6 9 b 12 15 18 21 24 27 30
组(P<0.05) ,其中红糖组脂肪含量显著高于蔗糖 培育时间/d Cultivation time
组和葡萄糖组(P<0.05) (表 2) 。 图 5 不同碳源对大黄鱼育苗水体硝酸盐含量的影响
2.4 不同碳源对大黄鱼鱼苗培育效果的影响 Fig. 5 The influence of different carbon sources on
经过 30 d 培育,各试验组鱼苗的绝对增长量、 nitrates content in L. crocea seedling water
表 1 不同碳源对大黄鱼育苗水体 pH 值的影响
Tab. 1 The impact of different carbon sources on the pH of L. crocea seedling water
培育时间/d Cultivation time
组别 Groups
3 6 9 12 15 18 21 24 27 30
对照 Control 8.02±0.04 a 7.98±0.03 a 7.95±0.02 a 7.88±0.03 a 7.85±0.02 a 7.53±0.01 a 7.52±0.01 a 7.31±0.02 a 7.42±0.02 a 7.21±0.02 a
红糖 Brown sugar 8.01±0.04 a 7.92±0.04 b 7.81±0.02 b 7.77±0.03 b 7.75±0.03 c 7.43±0.01 b 7.21±0.09 c 7.11±0.09 b 7.02±0.08 c 6.88±0.04 c
蔗糖 Sucrose 7.99±0.12 a 7.95±0.07 a 7.83±0.06 b 7.75±0.06 b 7.76±0.03 c 7.45±0.06 b 7.28±0.04 c 7.18±0.08 b 7.09±0.10 b 7.01±0.10 b
葡萄糖 Glusose 7.98±0.11 a 7.88±0.11 b 7.85±0.09 b 7.73±0.08 b 7.71±0.03 b 7.53±0.09 a 7.38±0.10 b 7.29±0.08 a 7.12±0.08 b 7.08±0.03 b
表 2 各组生物絮团营养成分
Tab. 2 Nutrient compositios of bioflocs in each group
组别 Groups
指标 Indices
对照 Control 葡萄糖 Glusose 蔗糖 Sucrose 红糖 Brown sugar
粗蛋白质 Crude proteins 25.33±0.11 C 34.70±0.45 B 36.35±2.21 B 37.43±1.92 A
粗脂肪 Crude fats 6.33±0.18 C 8.47±0.32 B 8.38±0.13 B 9.66±0.14 A
粗灰分 Crude ash 18.16±0.34 A 16.15±0.14 B 16.42±0.13 B 14.37±0.14 C
水分 Water 50.17±0.55 A 38.67±0.84 B 40.10±0.72 B 38.54±0.56 B
注:同一指标中不同大写字母表示组间差异显著(P<0.05) ,相同则差异不显著(P>0.05) 。表 3 同此。
Notes: Values in the same index with different capital letters mean there are significant differences among groups (P<0.05),while the same letters
mean no significant differences . It’s the same as table 3.
表 3 不同碳源对大黄鱼鱼苗生长的影响
Tab. 3 Effects of different carbon sources on the growth of L. crocea fry
组别 Groups
指标 Indices
对照 Control 葡萄糖 Glusose 蔗糖 Sucrose 红糖 Brown sugar
初全长/mm Initial total length 20.3±1.3 A 20.3±1.3 A 20.3±1.3 A 20.3±1.3 A
末全长/mm Final total length 43.3±2.8 B 46.3±3.1 B 47.6±3.2 B 50.7±2.9 A
绝对增长量/mm Absolute growth 23.1±1.2 C 26.0±1.3 B 27.3±1.1 B 30.4±1.9 A
特定生长率/% Specific growth rate 2.52±0.02 C 2.75±0.02 B 2.84±0.13 B 3.05±0.09 A
存活率/% Survial rate 55.53±2.12 C 72.17±1.88 B 73.23±1.97 B 78.73±1.75 A