
Page 48 - 卫星导航2021年第1-2合期
P. 48
Du et al. Satell Navig (2021) 2:3 Page 15 of 22
Table 3 Excluded measurements with diferent FDE methods compared with simulated faults in measurements
Numbers of epoch Measurements Simulated Excluded measurements
with 1‑s interval with simulated outliers outliers (m)
Simple FDE Advanced FDE Chi‑square test
based FDE
2137 G03 L1 ‑1.0061 G03 L1 G03 L1 G03 L1
G31 L1 ‑0.6252 G31 L1 G31 L1 G31 L1
2145 G01 L1 ‑0.8257 G01 L1 G01 L1 G01 L1
G31 L1 ‑0.5368 G31 L1 G31 L1 G31 L1
2146 G03 L1 ‑0.4397 G03 L1 G03 L1 G03 L1
G23 L1 ‑0.2917 – G23 L1 G23 L1
Wrong exclusion:
L1: G09, G18, E26, E07, E27
L2: G09, G23, G18
L5: G09, E26, E27, E07
2182 G03 L1 0.4673 G03 L1 G03 L1 G03 L1
2264 G16 L1 0.5393 G16 L1 G16 L1 G16 L1
G31 L1 ‑0.3877 G31 L1 G31 L1 G31 L1
2550 G03 L1 0.2335 – G03 L1 G03 L1
G22 L1 0.4185 G22 L1 G22 L1 G22 L1
Wrong exclusion:
L1: G14, G18, G23, E07, E27
L2: G03, G18, G22, G23
L5: G03, E27
2580 G22 L1 ‑0.5009 G22 L1 G22 L1 G22 L1
G23 L1 0.5970 G23 L1 G23 L1 G23 L1
Wrong exclusion: G09 L1
2854 G09 L1 0.5608 G09 L1 G09 L1 G09 L1
G16 L1 0.8676 G16 L1 G16 L1 G16 L1
2870 G09 L1 ‑0.0654 – – –
G26 L1 0.0930 G26 L1 G26 L1 G26 L1
2911 G09 L1 ‑0.5632 G09 L1 G09 L1 G09 L1
G22 L1 ‑0.4518 G22 L1 G22 L1 G22 L1
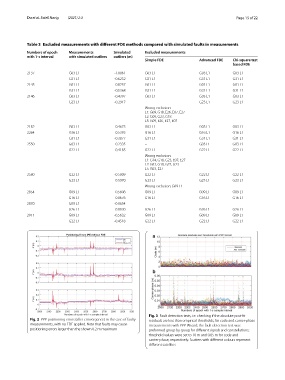
Fig. 3 Fault detection tests, i.e. checking if the absolute post‑ft
Fig. 2 PPP positioning errors (after convergence) in the case of faulty residuals are less than empirical thresholds, for code and carrier‑phase
measurements, with no FDE applied. Note that faults may cause measurements with PPP‑Wizard; the fault detection test was
positioning errors larger than the shown 0.2 m maximum preformed group by group for diferent signals and constellations;
threshold values were set to 10 m and 0.05 m for code and
carrier‑phase, respectively. Scatters with diferent colours represent
diferent satellites