
Page 125 - 卫星导航2021年第1-2合期
P. 125
Xia et al. Satell Navig (2021) 2:8 Page 11 of 19
Static positioning analysis
Figure 14 illustrates the number of tracked satellites and
GDOP values for each constellation during the two-hour
static observation period.
At the epoch of the 4230th second in the top panel the
number of the tracked satellites is zero. Tis indicates
that the smartphone loses lock of all satellites. From the
fgure, GPS satellites have the best visibility at the static
site with an average of about 10.0 visible satellites. BDS is
in the second with an average number of 8.2. Before the
5455th second, the number of visible satellites remains
about 8–9, but declines afterwards as some satellites drop
below the elevation cutof angle. Galileo has the small-
est number of visible satellites with an average of 4.8,
although the number is relatively stable for most of the
time. Teir GDOP values give a consistent interpretation.
Te ascending order of the overall GDOP value is GPS,
GLONASS, BDS and Galileo, and their average GDOP
are 1.8, 2.5, 2.7 and 9.7, respectively. Te GDOP value of
BDS increases signifcantly between the 6745th second
and the 6935th second due to a decrease in the number
of valid satellites, which raises its overall GDOP value.
Galileo has very large GDOP values at the beginning and
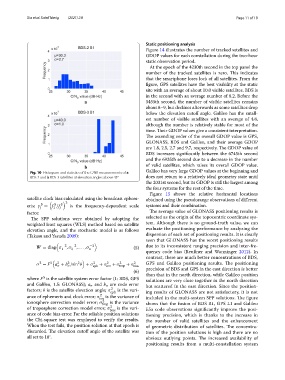
Fig. 10 Histogram and statistics of the C/N0 measurements of a
BDS-2 and b BDS-3 satellites at elevation angles above 45° does not return to a relatively ideal geometry state until
the 2031st second, but its GDOP is still the largest among
the four systems for the rest of the time.
Figure 15 shows the relative horizontal locations
satellite clock bias calculated using the broadcast ephem- obtained using the pseudorange observations of diferent
2
S
S
eris; γ = f /f S is the frequency-dependent scale systems and their combination.
j 1 j
factor. Te average value of GLONASS positioning results is
Te SPP solutions were obtained by adopting the selected as the origin of the topocentric coordinate sys-
weighted least squares (WLS) method based on satellite tem. Although there is no ground-truth value, we can
elevation angle, and the stochastic model is as follows evaluate the positioning performance by analyzing the
(Takasu and Yasuda 2009): dispersion of each set of positioning results. It is clearly
seen that GLONASS has the worst positioning results
−2 −2 −2 due to its inconsistent ranging precision and inter-fre-
W = diag σ , σ , . . . , σ (5)
1 2 n
quency code bias (Reußner and Wanninger 2012). In
contrast, there are much better concentrations of BDS,
2
2
2
2
2
2
2
2
σ = F S a + b /sin θ + σ eph + σ ion + σ trop + σ bias GPS and Galileo positioning results. Te positioning
σ
σ
(6) precision of BDS and GPS in the east direction is better
than that in the north direction, while Galileo position
where F is the satellite system error factor (1: BDS, GPS solutions are very close together in the north direction
S
and Galileo, 1.5: GLONASS); a σ and b σ are code error but scattered in the east direction. Since the position-
factors; θ is the satellite elevation angle; σ 2 is the vari-
eph ing results of GLONASS are not satisfactory, it is not
ance of ephemeris and clock error; σ 2 is the variance of included in the multi-system SPP solutions. Te fgure
ion
ionosphere correction model error; σ 2 is the variance shows that the fusion of BDS B1, GPS L1 and Galileo
trop
2
of troposphere correction model error; σ bias is the vari- E5a code observations signifcantly improve the posi-
ance of code bias error. For the reliable position solutions tioning precision, which is thanks to the increase in
the Chi-square test was employed to verify the results. the number of valid satellites and the enhancement
When the test fails, the position solution at that epoch is of geometric distribution of satellites. Te concentra-
discarded. Te elevation cutof angle of the satellite was tion of the position solutions is high and there are no
all set to 10°. obvious outlying points. Te increased availability of
positioning results from a multi-constellation system