
Page 121 - 卫星导航2021年第1-2合期
P. 121
Xia et al. Satell Navig (2021) 2:8 Page 7 of 19
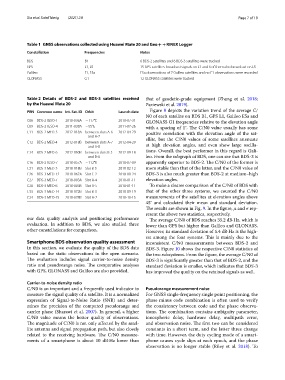
Table 1 GNSS observations collected using Huawei Mate 20 and Geo + + RINEX Logger
Constellation Frequencies Notes
BDS B1 6 BDS-2 satellites and 6 BDS-3 satellites were tracked
GPS L1, L5 15 GPS satellites broadcast signals on L1 and 6 of them also broadcast on L5
Galileo E1, E5a E5a observations of 7 Galileo satellites and no E1 observations were recorded
GLONASS G1 12 GLONASS satellites were tracked
Table 2 Details of BDS-2 and BDS-3 satellites received that of geodetic-grade equipment (Zhang et al. 2018;
by the Huawei Mate 20 Paziewski et al. 2019).
PRN Common name Int. Sat. ID Orbit Launch date Figure 8 depicts the variation trend of the average C/
N0 of each satellite on BDS B1, GPS L1, Galileo E5a and
C06 BDS-2 IGSO-1 2010-036A ~ 117°E 2010-07-31 GLONASS G1 frequencies relative to the elevation angle
C09 BDS-2 IGSO-4 2011-038A ~ 95°E 2011-07-26 with a spacing of 1°. Te C/N0 value usually has some
C11 BDS-2 MEO-3 2012-018A between slots A-6 2012-04-29 positive correlation with the elevation angle of the sat-
and A-7 ellite, but the C/N0 values of some satellites attenuate
C12 BDS-2 MEO-4 2012-018B between slots A-7 2012-04-29
and A-8 at high elevation angles, and even show large oscilla-
C14 BDS-2 MEO-6 2012-050B between slots B-3 2012-09-18 tions. Overall, the best performer in this regard is Gali-
and B-4 leo. From the subgraph of BDS, one can see that BDS-3 is
C16 BDS-2 IGSO-7 2018-057A ~ 112°E 2018-07-09 apparently superior to BDS-2. Te C/N0 of the former is
C21 BDS-3 MEO-3 2018-018B Slot B-5 2018-02-12 more stable than that of the latter, and the C/N0 value of
C26 BDS-3 MEO-12 2018-067A Slot C-2 2018-08-24 BDS-3 is also much greater than BDS-2 at medium–high
C27 BDS-3 MEO-7 2018-003A Slot A-4 2018-01-11 elevation angles.
C28 BDS-3 MEO-8 2018-003B Slot A-5 2018-01-11 To make a clearer comparison of the C/N0 of BDS with
C33 BDS-3 MEO-14 2018-072B Slot B-3 2018-09-19 that of the other three systems, we counted the C/N0
C34 BDS-3 MEO-15 2018-078B Slot A-7 2018-10-15 measurements of the satellites at elevation angles above
45° and calculated their mean and standard deviation.
Te results are shown in Fig. 9. In the fgure, µ and σ rep-
resent the above two statistics, respectively.
our data quality analysis and positioning performance Te average C/N0 of BDS reaches 35.2 dB·Hz, which is
evaluation. In addition to BDS, we also studied three lower than GPS but higher than Galileo and GLONASS.
other constellations for comparison. However, its standard deviation of 5.4 dB·Hz is the high-
est among the four systems. Tis is mainly due to the
Smartphone BDS observation quality assessment inconsistent C/N0 measurements between BDS-2 and
In this section, we evaluate the quality of the BDS data BDS-3. Figure 10 shows the respective C/N0 statistics of
based on the static observations in the open scenario. the two subsystems. From the fgure, the average C/N0 of
Te evaluation includes signal carrier-to-noise density BDS-3 is signifcantly greater than that of BDS-2, and the
ratio and pseudorange noise. Te comparative analyses standard deviation is smaller, which indicates that BDS-3
with GPS, GLONASS and Galileo are also provided. has improved the quality on the retained signals as well.
Carrier‑to‑noise density ratio
C/N0 is an important and a frequently used indicator to Pseudorange measurement noise
measure the signal quality of a satellite. It is a normalized For GNSS single-frequency single point positioning, the
expression of Signal-to-Noise Ratio (SNR) and deter- phase minus code combination is often used to verify
mines the precision of the computed pseudorange and the consistency between code and the phase observa-
carrier phase (Sharawi et al. 2007). In general, a higher tions. Te combination contains ambiguity parameter,
C/N0 value means the better quality of observations. ionospheric delay, hardware delay, multipath error,
Te magnitude of C/N0 is not only afected by the satel- and observation noise. Te frst two can be considered
lite antenna and signal propagation path, but also closely constants in a short term, and the latter three change
related to the receiving hardware. Te C/N0 measure- with time. However, the duty cycling mode of a smart-
ments of a smartphone is about 10 dB·Hz lower than phone causes cycle slips at each epoch, and the phase
observation is no longer stable (Riley et al. 2018). To