
Page 123 - 卫星导航2021年第1-2合期
P. 123
Xia et al. Satell Navig (2021) 2:8 Page 9 of 19
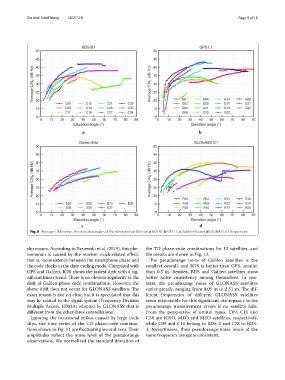
Fig. 8 Average C/N0 versus the elevation angles of the observed satellites on a BDS B1, b GPS L1, c Galileo E5a and d GLONASS G1 frequencies
slip occurs. According to Paziewski et al. (2019), this phe- the TD phase-code combinations for 12 satellites, and
nomenon is caused by the receiver clock-related efect, the results are shown in Fig. 12.
that is, inconsistency between the smartphone phase and Te pseudorange noise of Galileo satellites is the
the code clocks in the duty cycling mode. Compared with smallest overall, and BDS is better than GPS, smaller
GPS and Galileo, BDS shows the fastest drift with a sig- than 0.5 m. Besides, BDS and Galileo satellites show
nifcant linear trend. Tere is no obvious regularity in the better noise consistency among themselves. In con-
drift of Galileo phase-code combinations. However, the trast, the pseudorange noise of GLONASS satellites
above drift does not occur for GLONASS satellites. Te varies greatly, ranging from 0.05 m to 2.51 m. Te dif-
exact reason is not yet clear, but it is speculated that this ferent frequencies of diferent GLONASS satellites
may be related to the signal system (Frequency Division seem responsible for this signifcant discrepancy in the
Multiple Access, FDMA) adopted by GLONASS that is pseudorange measurement errors if no satellite fails.
diferent from the other three constellations. From the perspective of orbital types, C09, C11 and
Ignoring the occasional spikes caused by large cycle C28 are IGSO, MEO and MEO satellites, respectively,
slips, the time series of the TD phase-code combina- while C09 and C11 belong to BDS-2 and C28 to BDS-
tions shown in Fig. 11 are fuctuating around zero. Teir 3. Nevertheless, their pseudorange noise levels at the
amplitudes refect the noise level of the pseudorange same frequency are quite consistent.
observations. We normalized the standard deviation of