Page 93 - 《水产学报》2026年第04期
P. 93

4 期                     邹欣泰,等:基于体长数据的舟山渔场小黄鱼资源评估                                         50 卷


                                                  表 3    M/K  参数估算结果
                                           Tab. 3    Estimation results of M/K parameters
                    K组            M 1 /K       M 2 /K       M 3 /K       M 4 /K       M 5 /K       M 6 /K
                   K group
                                  1.41         1.29         1.40         1.48         1.99         0.92
                     K 1
                                  1.41         1.33         1.40         1.48         2.02         0.94
                     K 2
                                  1.41         1.24         1.40         1.47         1.98         0.90
                     K 3
              注:K 1  = 0.28;K 2  = 0.24;K 3  = 0.31。M 1 、M 2 、M 3 、M 4 、M 5 、M 6 分别由公式(3)、(4)、(5)、(6)、(7)、(8)计算得出。
              Notes: K1 = 0.28; K2 = 0.24; K3 = 0.31. M 1 , M 2 , M 3 , M 4 , M 5 , and M 6  were calculated using Equations (3), (4), (5), (6), (7), and (8), respectively.


                                                                  20.0
                             0.25

                             0.20                                 15.0

                             0.15
                            SPR                                  F/M  10.0
                             0.10

                             0.05                                 5.0

                               0
                                 2019.04  2021.11  2023.11  2024.04  2019.04  2021.11  2023.11  2024.04
                                            季度                                   季度
                                            quarter                             quarter
                                             (a)                                  (b)

                            142.0                                169.0
                                                                 166.0
                            139.0

                                                                 139.5
                          SL 50  116.5                         SL 95
                            115.5
                                                                 131.5


                            105.6
                                                                 121.0
                                 2019.04  2021.11  2023.11  2024.04  2019.04  2021.11  2023.11  2024.04
                                            季度                                   季度
                                            quarter                             quarter
                                             (c)                                  (d)
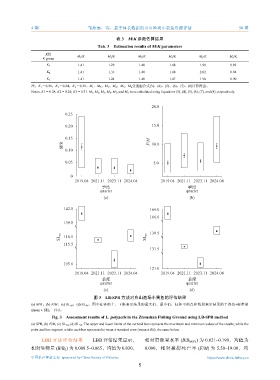
                                         图 3    LB-SPR  方法对舟山渔场小黄鱼的评估结果
              (a) SPR,(b) F/M,(c) SL 50 ,(d) SL 95 。图中柱体的上、下限表示结果的最大值、最小值;柱体中的点和线段表示结果的平均值±标准误
              (mean ± SE);下同。
                       Fig. 3 Assessment results of L. polyactis in the Zhoushan Fishing Ground using LB-SPR method
              (a) SPR, (b) F/M, (c) SL 50 , (d) SL 95 . The upper and lower limits of the vertical bars represent the maximum and minimum values of the results, while the
              point and line segment within each bar represent the mean ± standard error (mean ± SE); the same below.

                    LBB  方法评估结果  LBB         评估结果显示,           相对资源量水平        (B/B MSY ) 为  0.021~0.190,均值为
              相对生物量      (B/B ) 为  0.008 5~0.065,均值为  0.030,   0.090,相对捕捞死亡率         (F/M) 为  5.50~19.00,均
                             0
              中国水产学会主办  sponsored by China Society of Fisheries                          https://www.china-fishery.cn
                                                            5
   88   89   90   91   92   93   94   95   96   97   98