
Page 36 - 《水产学报》2026年第2期
P. 36
2 期 水 产 学 报 50 卷
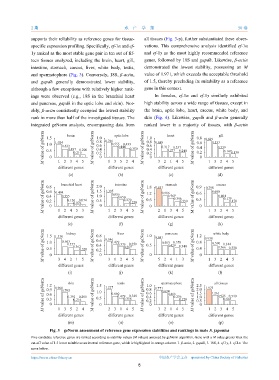
supports their reliability as reference genes for tissue- all tissues (Fig. 3-p), further substantiated these obser-
specific expression profiling. Specifically, ef-1α and ef- vations. This comprehensive analysis identified ef-1α
1γ ranked as the most stable gene pair in ten out of fif- and ef-1γ as the most highly recommended reference
teen tissues analyzed, including the brain, heart, gill, genes, followed by 18S and gapdh. Likewise, β-actin
intestine, stomach, caecus, liver, white body, testis, demonstrated the lowest stability, possessing an M
and spermatophore (Fig. 3). Conversely, 18S, β-actin, value of 1.971, which exceeds the acceptable threshold
and gapdh generally demonstrated lower stability, of 1.5, thereby precluding its suitability as a reference
although a few exceptions with relatively higher rank- gene in this context.
ings were observed (e.g., 18S in the branchial heart In females, ef-1α and ef-1γ similarly exhibited
and pancreas, gapdh in the optic lobe and skin). Not- high stability across a wide range of tissues, except in
ably, β-actin consistently occupied the lowest stability the brain, optic lobe, heart, caecus, white body, and
rank in more than half of the investigated tissues. The skin (Fig. 4). Likewise, gapdh and β-actin generally
integrated geNorm analysis, encompassing data from ranked lower in a majority of tissues, with β-actin
M value of geNorm 1.0 1.024 0.632 0.497 0.200 M value of geNorm 0.8 0 0.766 0.555 0.444 0.350 M value of geNorm 0.8 0.688 0.317 0.257 0.240 M value of geNorm 0.6 0.553 0.339 0.147 0.130
1.5 brain 1.0 optic lobe 1.0 heart 0.8 0.689 gill
0.433
0.6
0.6
0.4
0.4
0.4
0.271
0.5
0.2
0.2
0.210
0.2
0
0
0
1 2 3 4 5
different genes
different genes 1 3 5 2 4 3 2 1 4 5 1 3 2 4 5
different genes
different genes
(c)
(a) intestine stomach caecus
(d)
(b)
M value of geNorm 0.8 0 0.498 0.355 0.076 M value of geNorm 2.0 0 1.395 0.956 0.270 M value of geNorm 1.8 1.631 0.986 0.767 0.396 M value of geNorm 0.9 0 0.798 0.600 0.401 0.170
branchial heart
1.5
0.6
0.6
1.2
1.0
0.4
0.650
0.179
0.3
0.6
0.5
0.130
0.074
0.2
0.330
0.250
0
1 2 4 5 3
different genes
different genes 1 2 3 4 5 2 1 3 4 5 1 3 2 4 5
different genes
different genes
(h)
(e) liver pancreas white body
(f)
(g)
M value of geNorm 1.5 1.330 0.663 0.362 0.320 M value of geNorm 0.8 0.546 0.429 0.375 0.267 M value of geNorm 1.0 0.841 0.503 0.429 0.340 M value of geNorm 1.2 0 0.930 0.590 0.344
kidney
0.6
0.8
0.378
1.0
0.557
0.250
0.5
0.4
0.366
0.330
0.5
0.4
0.2
0
0
0
3 4 2 1 5
different genes
different genes
different genes
different genes 3 1 2 4 5 5 2 4 1 3 1 3 2 4 5
(i) testis spermatophore all tissues
(k)
(l)
(j)
M value of geNorm 1.2 0.960 0.795 0.216 M value of geNorm 1.5 1.227 0.660 0.479 0.358 M value of geNorm 1.0 0.771 0.634 0.466 0.220 M value of geNorm 2.5 0 1.973 1.261 0.925 0.540
skin
2.0
0.8
0.9
1.0
0.6
1.5
0.6
0.340
0.236
0.391
0.200
1.0
0.4
0.5
0.563
0.3
0.5
0.2
0
0
0
1 3 5 2 4
different genes
different genes
different genes 2 3 1 4 5 3 2 1 4 5 1 2 3 4 5
different genes
(m) (n) (o) (p)
Fig. 3 geNorm assessment of reference gene expression stabilities and rankings in male S. japonica
Five candidate reference genes are ranked according to stability values (M values) assessed by geNorm algorithm. Gene with a M value greater than the
cut-off value of 1.5 is not suitable as an internal reference gene, which is highlighted in orange column. 1. β-actin, 2. gapdh, 3. 18S, 4. ef-1γ, 5. ef-1α. The
same below.
https://www.china-fishery.cn 中国水产学会主办 sponsored by China Society of Fisheries
8