Page 40 - 《水产学报》2026年第2期
P. 40

2 期                                     水    产    学    报                                 50 卷


                                                              male
                                         brain       0.35  0.19  0.21  1.06  0.47
                                     optic lobe      0.39  0.57  0.34  1.03  0.40
                                         heart       0.85  0.18  0.27  0.30  0.33
                                          gill       0.40  0.84  0.79  1.04  0.86
                                                                                   coefficient of variation
                                  branchial heart    0.29  0.23  0.36  0.50  0.55
                                                                                      1.00
                                      intestine      0.36  0.74  0.75  1.04  1.01     3.72
                                      stomach        0.88  1.50  1.32  1.48  1.80     13.81
                                        caecus       0.64  1.15  1.07  1.26  1.42
                                                                                   standard deviation
                                       kidney        0.76  2.40  1.99  2.35  2.63    3
                                         liver       0.60  0.94  0.79  0.89  0.85
                                      pancreas       0.29  1.05  0.27  0.19  0.51
                                                                                     2
                                    white body       0.50  1.00  0.80  0.48  0.87
                                         skin        1.17  2.08  1.76  1.21  1.86
                                                                                     1
                                         testis      0.85  1.49  1.23  1.58  1.01
                                  spermatophore      1.04  1.20  1.12  0.81  0.98
                                     all tissues     1.06  1.44  1.25  2.76  1.88    0
                                                  18S   ef-1α  ef-1γ  β-actin gapdh
                                                              (a)
                                                             female
                                         brain       0.29  0.39  0.38  0.78  1.59
                                     optic lobe      0.69  0.34  0.38  0.45  0.59
                                         heart       0.23  0.12  0.42  0.41  0.28
                                          gill       1.03  0.79  0.57  2.09  1.25
                                                                                   coefficient of variation
                                  branchial heart    0.38  0.46  0.40  0.58  0.23
                                                                                       0.65
                                      intestine      0.85  0.76  0.74  0.57  0.84      2.96
                                      stomach        0.34  0.31  0.42  0.47  0.46      13.46
                                        caecus       1.57  0.90  1.34  1.34  1.53
                                       kidney        0.77  0.43  0.57  1.04  0.39  standard deviation
                                                                                     3
                                         liver       1.01  1.16  0.99  1.06  0.87
                                      pancreas       0.39  0.22  0.28  0.36  0.45
                                    white body       0.35  0.20  0.36  0.75  0.38    2
                                         skin        0.22  0.17  0.26  0.76  0.17
                                        ovary        0.33  0.85  0.46  1.07  1.20
                                                                                     1
                                nidamental gland     1.23  1.44  1.46  1.07  1.39
                        accessory nidamental gland   0.60  0.40  0.48  1.26  0.72
                                     all tissues     1.42  0.98  1.16  2.65  1.50    0

                                                  18S   ef-1α  ef-1γ  β-actin gapdh
                                                              (b)
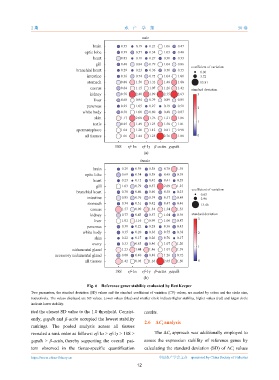
                                      Fig. 6 Reference genes stability evaluated by BestKeeper
              Two parameters, the standard deviation (SD) values and the standard coefficient of variation (CV) values, are marked by colors and the circle size,
              respectively. The values displayed are SD values. Lower values (blue) and smaller circle indicate higher stability, higher values (red) and larger circle
              indicate lower stability.
              ited the closest SD value to the 1.0 threshold. Consist-  results.
              ently, gapdh and β-actin occupied the lowest stability
                                                                2.6    ΔC analysis
                                                                      t
              rankings.  The  pooled  analysis  across  all  tissues
              revealed a rank order as follows: ef-1α > ef-1γ > 18S >  The ΔC  approach was additionally employed to
                                                                         t
              gapdh  >  β-actin, thereby  supporting  the  overall   pat-  assess  the  expression  stability  of  reference  genes  by
              tern  observed  in  the  tissue-specific  quantification  calculating the standard deviation (SD) of ΔC  values
                                                                                                     t
              https://www.china-fishery.cn                           中国水产学会主办    sponsored by China Society of Fisheries
                                                            12
   35   36   37   38   39   40   41   42   43   44   45