
Page 41 - 《水产学报》2026年第2期
P. 41
2 期 李 双,等:跨组织/性别系统评估曼氏无针乌贼内参基因的稳定性 50 卷
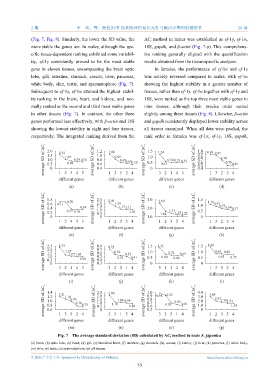
(Fig. 7, Fig. 8). Similarly, the lower the SD value, the ΔC method in males was established as ef-1γ, ef-1α,
t
more stable the genes are. In males, although the spe- 18S, gapdh, and β-actin (Fig. 7-p). This comprehens-
cific tissue-dependent ranking exhibited some variabil- ive ranking generally aligned with the quantification
ity, ef-1γ consistently proved to be the most stable results obtained from the tissue-specific analyses.
gene in eleven tissues, encompassing the brain optic In females, the performance of ef-1α and ef-1γ
lobe, gill, intestine, stomach, caecus, liver, pancreas, was notably reversed compared to males, with ef-1α
white body, skin, testis, and spermatophore (Fig. 7). showing the highest stability in a greater number of
Subsequent to ef-1γ, ef-1α attained the highest stabil- tissues, rather than ef-1γ. ef-1α together with ef-1γ and
ity ranking in the brain, heart, and kidney, and nor- 18S, were ranked as the top three most stable genes in
mally ranked as the second and third most stable genes nine tissues, although their precise order varied
in other tissues (Fig. 7). In contrast, the other three slightly among these tissues (Fig. 8). Likewise, β-actin
genes performed less effectively, with β-actin and 18S and gapdh consistently displayed lower stability across
showing the lowest stability in eight and four tissues, all tissues examined. When all data were pooled, the
respectively. The integrated ranking derived from the rank order in females was ef-1α, ef-1γ, 18S, gapdh,
average SD of ΔC t 1.5 0 1.61 1.07 0.79 0.76 average SD of ΔC t 1.0 0.84 0.67 0.65 0.58 average SD of ΔC t 1.0 0.62 0.54 0.53 0.51 average SD of ΔC t 0.9 0.89 0.87 0.70 0.50 0.49
2.0 1.2 1.08 1.5 1.24 1.0
0.8
1.0
0.7
0.8
0.5
0.6
0.88
0.5
0.6
0.5
0.4
0.4
0
1 2 3 4 5
different genes 1 3 5 2 4 3 2 1 4 5 1 3 2 5 4
different genes
different genes
different genes
(a) (b) (c) (d)
average SD of ΔC t 0.8 0.71 0.37 0.36 0.34 average SD of ΔC t 2.5 2.05 1.59 1.151.11 1.01 average SD of ΔC t 3.0 2.60 1.43 1.25 1.22 average SD of ΔC t 1.5 1.10 0.93 0.75 0.64 0.57
0.70
2.0
0.6
1.0
1.5
2.0
0.4
1.0
0.5
0.2
0.5
1.66
1.0
0
0
0
1 2 4 5 3
1 2 5 3 4
different genes different genes 1 2 3 5 4 1 3 2 5 4
different genes
different genes
(e) (f) (g) 1.44 (h)
average SD of ΔC t 2.5 2.33 1.25 0.98 average SD of ΔC t 0.8 0.72 0.56 0.51 0.41 average SD of ΔC t 1.5 1.35 0.80 0.72 0.69 0.65 average SD of ΔC t 1.5 0 0.83 0.80 0.75
2.0
0.7
1.0
1.0
0.6
1.5
1.051.03
0.5
1.0
0.83
0.5
0.5
0.53
0.5
0.4
0
0.3
0
3 2 1 4 5
different genes
different genes 3 2 5 1 4 5 1 3 2 4 1 3 5 2 4
different genes
different genes
(i) (j) (k) (l)
average SD of ΔC t 1.4 1.21 1.10 0.99 0.78 0.73 average SD of ΔC t 2.5 0 2.08 1.08 0.98 0.89 average SD of ΔC t 1.0 0.98 0.70 0.65 0.61 average SD of ΔC t 4.0 0 3.04 2.03 1.74 1.53 1.53
0.92
0.9
2.0
1.2
3.0
0.8
1.5
1.0
2.0
1.0
0.7
1.10
1.0
0.8
0.5
0.6
0.6
0.5
1 3 5 2 4
1 2 3 5 4
different genes 2 3 1 5 4 3 2 5 1 4 different genes
different genes
different genes
(m) (n) (o) (p)
Fig. 7 The average standard deviation (SD) calculated by ΔC t method in male S. japonica
(a) brain, (b) optic lobe, (c) heart, (d) gill, (e) branchial heart, (f) intestine, (g) stomach, (h), caecus, (i) kidney, (j) liver, (k) pancreas, (l) white body,
(m) skin, (n) testis, (o) spermatophore, (p) all tissues.
中国水产学会主办 sponsored by China Society of Fisheries https://www.china-fishery.cn
13