
Page 49 - 《水产学报》2025年第12期
P. 49
陈帅钰,等 水产学报, 2025, 49(12): 129604
control P crit LOE R24
M
M
M M
200 g H H H M
H P
M
50 μm 50 μm P 50 μm 50 μm
1 2 3 4
P
P
50 g H H
H M M M
M
50 μm 50 μm 50 μm 50 μm
5 6 H 7 8
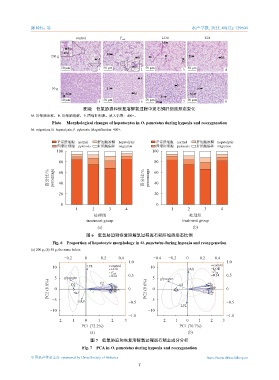
图版 低氧胁迫和恢复溶解氧过程中斑石鲷肝细胞形态变化
M. 肝细胞迁移,H. 肝细胞溶解,P. 固缩肝细胞。放大倍数:400×。
Plate Morphological changes of hepatocytes in O. punctatus during hypoxia and reoxygenation
M. migration, H. hepatolysis, P. pyknosis. Magnification: 400×.
正常肝细胞 normal 肝细胞溶解 hepatolysis 正常肝细胞 normal 肝细胞溶解 hepatolysis
固缩肝细胞 pyknosis 肝细胞偏移 migration 固缩肝细胞 pyknosis 肝细胞偏移 migration
100 100
80 80
百分比/% percentage 60 百分比/% percentage 60
40
40
20 20
0 0
1 2 3 4 1 2 3 4
处理组 处理组
treatment group treatment group
(a) (b)
图 6 低氧胁迫和恢复溶解氧过程斑石鲷肝细胞形态比例
Fig. 6 Proportion of hepatocyte morphology in O. punctatus during hypoxia and reoxygenation
(a) 200 g, (b) 50 g, the same below.
−0.2 0 0.2 0.4 −0.4 −0.2 0 0.2 0.4
1.0 1.0
10 LPL control 10 control
LOE FAS LOE
R24
P crit 0.5 P crit 0.5
5 glycogen C2 R24 5 glycogen
PC2 (8.8%) 0 D2 A3 0 PC2 (9.6%) 0 A3 A2 0
−5
FAS −0.5 −5 −0.5
LPL
−10 −10
−1.0 −1.0
−2 −1 0 1 2 3 −2 −1 0 1 2 3
PC1 (72.2%) PC1 (70.7%)
(a) (b)
图 7 低氧胁迫和恢复溶解氧过程斑石鲷主成分分析
Fig. 7 PCA in O. punctatus during hypoxia and reoxygenation
中国水产学会主办 sponsored by China Society of Fisheries https://www.china-fishery.cn
7