Page 165 - 《水产学报》2025年第7期
P. 165

杨梓静,等                                                                 水产学报, 2025, 49(7): 079513

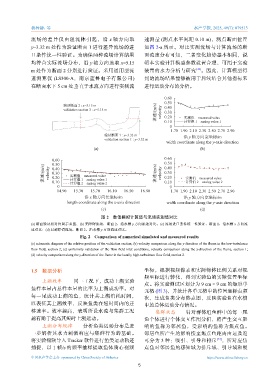
              流场的差异仅由阻流体引起,沿                    x 轴方向取         速测量    (测点水平间距       0.10 m),测点断面位置
              y=3.32 m  处作为验证断面        1  进行差异流场的进             如图   2-a 所示。对比实测流场与计算流场的断
              口条件统一性验证。为确保两种流场计算结果                             面流速分布可知,二者变化趋势基本相同,说
              均符合实际流场分布,沿              y 轴方向选取       x=5.15    明本实验计算模型参数设置合理,可用于实验
                                                                                     [32]
              m  处作为断面      2  分别进行验证。采用通用型流                   装置的水力分析与研究 。因此,计算模型得
              速测算仪      (LS300-A,南京蓝鲁电子有限公司)                   到的流场结果能够被用于后续结合其他指标来
              在断面水下       5 cm  处垂直于水流方向进行实测流                  进行运动分布的分析。


                                                                       0.60
                                                                       0.50
                                                                    流速/(m/s)  velocity  0.30  实测值  measured value
                            验证断面 2 : x=5.15 m                          0.40
                            validation section 2 : x=5.15 m
                                                                       0.20
                                                                       0.10
                                                                         0     计算值 1  analog value 1
                                                                          1.70 1.90 2.10 2.30 2.50 2.70 2.90
                                              验证断面 1 : y=3.32 m                沿 y 轴方向宽坐标/m
                                              validation section 1 : y=3.32 m
                                                                        width coordinate along the y-axis direction
                                         (a)                                          (b)

                                                                       0.60
                       0.60                                            0.50
                    流速/(m/s)  velocity 0.50  实测值  measured value    流速/(m/s)  velocity  0.40  实测值  measured value
                       0.40
                                                                       0.30
                       0.30
                                                                       0.20
                       0.20
                               计算值 1  analog value 1
                       0.10
                          0    计算值 2  analog value 2                   0.10     计算值 2  analog value 2
                                                                         0
                         14.90  15.30   15.70  16.10  16.50  16.90        1.70 1.90 2.10 2.30 2.50 2.70 2.90
                                     沿 x 轴方向长坐标/m                              沿 y 轴方向宽坐标/m
                              length coordinate along the x-axis direction  width coordinate along the y-axis direction
                                            (c)                                       (d)
                                            图 2    数值模拟计算值与流场实测值对比
              (a) 断面验证相对位置示意图;(b) 无障碍流场,断面        2,沿水槽  y 方向流速对比;(c) 流场进口条件统一性验证,断面          1,沿水槽  x 方向流
              速对比;(d) 局部障碍流场,断面      2,沿水槽  y 方向流速对比。
                                   Fig. 2 Comparison of numerical simulated and measured results
              (a) schematic diagram of the relative position of the validation section; (b) velocity comparison along the y-direction of the flume in the low-turbulence
              flow  field,  section  2;  (c)  uniformity  validation  of  the  flow  field  inlet  conditions,  velocity  comparison  along  the  x-direction  of  the  flume,  section  1;
              (d) velocity comparison along the y-direction of the flume in the locally high-turbulence flow field, section 2.


              1.5    数据分析                                      坐标,根据视频像素和实际物体比例关系对视
                                                               频坐标进行转化,得到实验鱼的实际位置坐标

                   上溯效率   同一工况下,成功上溯实验
                                                               点。将实验测试区划分为             9 cm × 9 cm  的矩形单
              鱼样本量占总样本量的比率为上溯成功率。对
                                                               元格  (图  3),并统计各单元格中的位置坐标点频
              每一尾成功上溯的鱼,统计其上溯消耗时间,                             次,生成鱼类分布热点图,反映实验鱼在水槽
              以表征其上溯效率,反映鱼类在短时间内的迁                             中的总体运动分布情况。

              移速率。效率越高,表明所设水流与集群工况                                 集群状态  针对群体组鱼群中的每一尾
              越有助于提高其短时上溯运动。                                   鱼个体进行个体交互作用分析,将产生交互影

                   上溯分布规律  分析鱼类运动分布是进                          响的鱼称为邻居鱼,受影响的鱼称为焦点鱼。
              一步解析其水力刺激响应与集群行为的基础。                             邻居鱼所产生的影响按至焦点鱼距离由远及近
              将实验视频导入         Tracker 软件进行鱼类运动轨迹               可分为    3  种:吸引、引导和排斥 ,所对应焦
                                                                                              [33]
              捕捉,以      1 帧/s 的频率抽样提取鱼体质心视频                    点鱼对邻居鱼的感知域为排斥域、引导域和吸

              中国水产学会主办  sponsored by China Society of Fisheries                          https://www.china-fishery.cn
                                                            5
   160   161   162   163   164   165   166   167   168   169   170