
Page 167 - 《水产学报》2025年第7期
P. 167
杨梓静,等 水产学报, 2025, 49(7): 079513
(a) (b)
(c) (d)
(e) (f) (g) (h) (i) (j)
流速/(m/s) 湍动能/(J/kg)
velocity turbulent kinetic energy
0 0.01 0.30 0.45 0.55 0.58 0.60 0.65 0.82 0.86 0 0.000 1 0.001 0 0.001 8 0.002 3 0.002 6 0.002 9 0.003 2 0.006 0 0.025 0
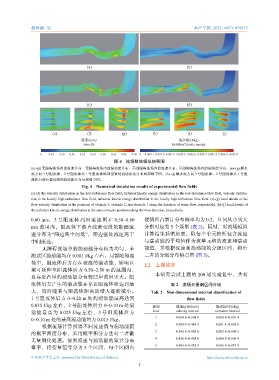
图 4 流场数值模拟结果图
(a)~(d) 无障碍流场内的流速分布、无障碍流场内的湍动能分布、局部障碍流场内的流速分布、局部障碍流场内的湍动能分布。(e)~(g) 顺水
流方向 3 号阻流体、2 号阻流体及 1 号阻流体局部位置处流场流速分布局部细节图,(h)~(j) 顺水流方向 3 号阻流体、2 号阻流体及 1 号阻
流体局部位置处流场湍动能分布局部细节图。
Fig. 4 Numerical simulation results of experimental flow fields
(a)-(d) the velocity distribution in the low-turbulence flow field, turbulent kinetic energy distribution in the low-turbulence flow field, velocity distribu-
tion in the locally high-turbulence flow field, turbulent kinetic energy distribution in the locally high-turbulence flow field. (e)-(g) local details of the
flow velocity distribution at the positions of obstacle 3, obstacle 2, and obstacle 1 along the direction of water flow, respectively. (h)-(j) local details of
the turbulent kinetic energy distribution at the same obstacle positions along the flow direction, respectively.
0.80 m/s,3 号阻流体周围流速则在 0.58~0.60 数值所占累计分布概率均为 0.2,区间从小到大
m/s 范围内。阻流体下游直线渐变段的断面流 分别对应为 5 个级别 (表 2)。同时,对流场模拟
速分布为“两边高中间低”,即边壁处流速高于 计算结果插值加密,取每个单元格所包含流速
中间流速。 与湍动能的平均值作为该单元格的流速和湍动
无障碍流场中的湍动能分布较为均匀,全 能值,并根据流速和湍动能的分级区间,得出
测试区湍动能均在 0.001 J/kg 左右。局部障碍流 二者的分级分布热点图 (图 5)。
场中,阻流体后方存在较高的湍动能,影响区
2.2 上溯效率
域可延伸至阻流体后方 0.50~2.50 m 的范围内,
本研究尝试上溯的 200 尾实验鱼中,共有
且靠近凸岸的湍动能分布较凹岸范围更大。阻
流体后方产生的湍动能在靠近阻流体处达到最 表 2 流场无量纲区间分级
大,而后随着与阻流体距离的增大逐渐减小。 Tab. 2 Non-dimensional interval classification of
1 号阻流体后方 0~0.20 m 处的湍动能最高达到 flow fields
0.035 J/kg 左右,2 号阻流体后方 0~0.10 m 处湍 级别 流速区间/(m/s) 湍动区间/(J/kg)
动能最高为 0.025 J/kg 左右,3 号阻流体后方 level velocity interval turbulent interval
0~0.10 m 处的最高湍动能约为 0.015 J/kg。 1 0.004 8~0.308 9 0.000 0~0.001 4
根据流场计算所得不同流速值与湍动能值 2 0.308 9~0.348 5 0.001 4~0.002 8
的概率密度分布,采用概率积分方法对二者做 3 0.348 5~0.428 0 0.002 8~0.004 5
无量纲化处理。按照流速与湍动能的累计分布 4 0.428 0~0.495 0 0.004 5~0.006 9
概率,将变量值等分为 5 个区间,每个区间内 5 0.495 0~0.932 3 0.006 9~0.037 4
中国水产学会主办 sponsored by China Society of Fisheries https://www.china-fishery.cn
7